Analytics for Ecommerce: A Complete 2026 Guide
A comprehensive guide to analytics for ecommerce. Learn the core metrics, data architecture, and self-serve tools you need to turn data into revenue.
https://www.youtube.com/watch?v=yzwkLe0d3VA
published
Outrank AI
analytics for ecommerce, ecommerce metrics, data warehouse, self-serve analytics, querio
c7a2e1cf-6909-426c-bb65-c7eb2d9e7eb3
You already have dashboards. Shopify has reports. Google Analytics is tracking sessions, product views, and purchases. Paid media platforms are all claiming credit for the same order. Your team still can't answer basic questions fast enough.
Which channels bring in customers who buy again. Which landing pages leak intent before add to cart. Which discount campaigns drove revenue but hurt margin. Why conversion dipped last week. Why your finance team's revenue number doesn't match the number in your marketing dashboard.
That situation isn't a tooling problem alone. It's an architecture problem.
For most brands, analytics for ecommerce breaks at the point where the business becomes meaningfully multi-channel. Once traffic comes from paid social, search, email, affiliates, organic, marketplaces, and mobile, the old setup stops working. You can still report on what happened. You can't reliably explain why it happened or what to do next.
Global ecommerce reached an estimated $6.4 trillion in sales in 2025, and online shopping accounted for 20.1% of all retail sales worldwide, according to Novadata's ecommerce statistics roundup. At that scale, small changes in conversion rate, average order value, or retention matter. The brands that operationalize analytics don't just build prettier dashboards. They make faster inventory, pricing, and growth decisions.
Table of Contents
Beyond Page Views Why Your Ecommerce Analytics Are Falling Short
Most ecommerce teams hit the same wall. They start with native platform reporting because it's fast. Then they add Google Analytics. Then a BI dashboard. Then a spreadsheet that reconciles all three because none of the numbers agree.
The result looks mature from the outside. Inside, the business is flying with partial instruments.
A founder asks a reasonable question: why did revenue soften even though traffic looked healthy? Marketing says paid performance was stable. Product says checkout didn't change. Ops says a popular SKU went out of stock. Finance says discounts were heavier than usual. Nobody is wrong. Nobody can prove the full story quickly.
The reporting trap
Traditional reporting is built around summarized outputs. Sessions by channel. Orders by day. Revenue by campaign. Those are useful, but they compress away the behavior you need to diagnose problems.
You can't solve funnel friction from daily rollups alone. You need to see the sequence: ad click, landing page view, product detail view, add to cart, checkout start, purchase, repeat order. Without that sequence, teams end up debating anecdotes.
Practical rule: If your analytics only tells you totals, it will fail the moment your team asks a causal question.
Why the old setup stops working
Native ecommerce analytics tools are good at store-level visibility. They're weak at stitching customer behavior across systems. Shopify knows the order. Google Analytics knows the session. Meta knows the ad exposure it can observe. Your ESP knows the email click. Support tools know the complaint. Finance knows the refund and fees.
A business decision rarely lives inside one of those tools.
What scales is a model that connects all of them. That means treating analytics for ecommerce as a data product, not as a pile of dashboards. The goal isn't more charts. The goal is faster answers to questions the business asks every day:
Acquisition quality: Which channels bring customers who place a second order instead of one-and-done buyers?
Merchandising impact: Which products get views but don't convert, and is the issue price, content, or availability?
Checkout performance: Where exactly do shoppers drop before purchase, by device and channel?
Commercial reality: Which campaigns drove revenue but weakened contribution after discounts, returns, shipping, and fees?
The teams that get this right move past descriptive reporting. They build a system that supports diagnosis, experimentation, and operational action.
The Core Ecommerce Metrics That Actually Drive Growth
You don't need fifty KPIs. You need a compact set that can explain business health from acquisition through retention.
Modern ecommerce analytics standardized around a small set of quantitative KPIs including conversion rate, revenue, and average order value, and even metrics like repurchase rate have a precise definition. It measures the share of customers making 2+ purchases in a period, as outlined in Plytix's introduction to ecommerce analytics. That standardization matters because teams need shared definitions, not improvised math.
A small metric set beats a giant KPI graveyard
Think of these metrics like a car dashboard. Speed alone is useless. You also need fuel, engine temperature, and warning lights. Ecommerce works the same way. Revenue tells you what happened. Conversion rate tells you how efficiently traffic turned into orders. AOV tells you what happened inside the basket. Lifetime value and churn tell you whether growth is durable.
The mistake I see most often is treating each metric as a scoreboard instead of a diagnostic.
Conversion rate is not just a site metric. It is often a traffic quality, merchandising, and checkout metric at the same time.
AOV isn't only about upsells. It can reveal catalog mix, discounting behavior, and bundling quality.
CAC on its own can push teams into low-quality acquisition.
LTV without a clear definition becomes fiction fast.
Churn matters most when the business has a recurring purchase pattern or subscription dynamic.
For a broader KPI glossary, this ecommerce KPI guide is a useful companion. The operating model still needs fewer metrics than are often monitored.
Essential Ecommerce KPIs Explained
Metric (Abbreviation) | Formula | What It Tells You |
|---|---|---|
Conversion Rate | Orders ÷ sessions or visitors, based on your defined denominator | How effectively traffic becomes buyers |
Average Order Value (AOV) | Total revenue ÷ number of orders | How much each order is worth on average |
Customer Acquisition Cost (CAC) | Acquisition spend ÷ new customers acquired | How expensive it is to win a new customer |
Customer Lifetime Value (LTV) | Business-defined estimate based on customer revenue over time | How much a customer is worth across the relationship |
Churn Rate | Customers lost ÷ customers at the start of the period | How quickly customers or subscribers stop buying |
Repurchase Rate | Customers with 2+ purchases ÷ total customers in the period | How many customers come back for another order |
How to use the metrics together
A healthy-looking AOV can hide a weak conversion rate. Strong conversion can hide poor customer quality if those buyers never return. Low CAC can be misleading if the channel mostly captures people who would've purchased anyway.
Use the metrics in pairs and triplets.
CAC + LTV: Shows whether acquisition economics can hold up over time.
Conversion rate + AOV: Separates persuasion problems from basket-value problems.
Repurchase rate + churn: Shows whether retention is improving or leaking.
Revenue + margin-aware analysis: Prevents the team from celebrating top-line growth that isn't commercially useful.
If a metric can't trigger an action, it probably doesn't belong on the main dashboard.
A practical operating view looks like this. Marketing owns traffic quality and new customer efficiency. Merchandising owns product conversion and basket composition. Product owns funnel progression. Finance keeps the business honest on net performance. The data team's job is to make sure those groups are working from the same metric definitions.
Designing a Modern Ecommerce Analytics Architecture
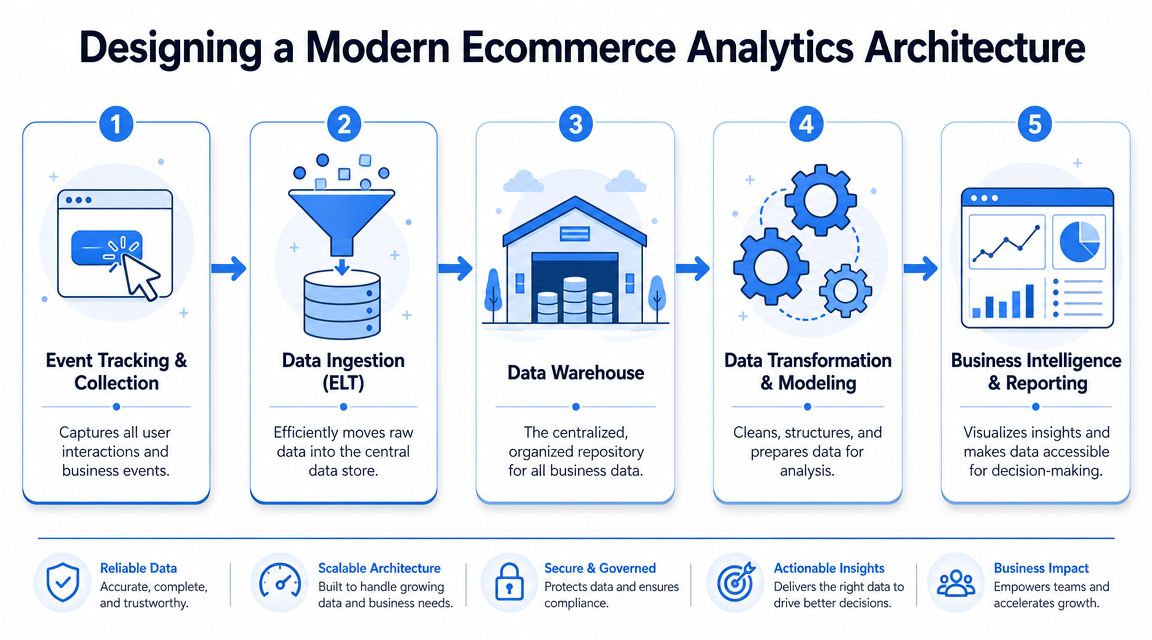
A scalable analytics stack starts with one opinionated decision. Store raw behavioral and business data in a central warehouse before you try to perfect reporting.
Connecting a BI tool directly to Shopify or relying on ad platform dashboards is fine for a small store. It doesn't survive complexity. Once you need customer-level joins, cohort analysis, product-level funnel tracking, or profit-aware measurement, that setup starts producing delays and arguments.
Why warehouse first wins
A technically well-designed stack should treat every meaningful shopper action as an event. Clicks, product views, add-to-cart actions, checkout starts, purchases, refunds, and repeat orders all belong in the model. Amplitude's ecommerce analytics guide makes the core point clearly: event-by-event tracking creates the granular data needed to diagnose funnel friction and attribute conversion changes to specific behaviors.
That event layer is the difference between "conversion is down" and "mobile shoppers from paid social are dropping between product detail and cart on a specific collection template."
Warehouse-first architecture also fixes a persistent organizational problem. Every department wants a slightly different cut of the same truth. Marketing wants acquisition views. Product wants user paths. Merchandising wants product interaction. Finance wants recognized sales and returns. If each tool calculates metrics independently, your team spends more time reconciling than analyzing.
For teams comparing stack patterns, this overview of data warehouse architectures is useful context.
The stack that scales
A practical architecture usually looks like this:
Event tracking and collection
Implement event instrumentation across web and app touchpoints. Every event should follow a consistent naming and property schema. Product viewed, cart updated, checkout started, order completed. Keep names boring and stable.
Data ingestion and ELT
Move raw events, store data, marketing spend, email activity, support events, and finance data into the warehouse with minimal transformation at ingest. Raw history matters. You will change your logic later.
A quick walkthrough helps if you're aligning non-technical stakeholders on the flow:
Data warehouse and modeling
Use a warehouse like BigQuery, Snowflake, or Redshift as the central store. Then model clean tables for sessions, users, orders, order lines, products, spend, and customer lifecycle states. Such modeling ensures metric definitions are durable.
Analysis and BI layer
Only after the model is stable should dashboards, notebooks, and ad hoc analysis sit on top. This layer should read from curated warehouse models, not directly from scattered source systems.
Good analytics architecture keeps raw data flexible and business definitions strict.
What usually breaks
Three issues show up repeatedly.
Failure mode | What it looks like | Better approach |
|---|---|---|
Tool-centric reporting | Every platform shows a different answer | Centralize logic in warehouse models |
Weak event design | Add-to-cart exists, but product context is missing | Standardize event properties and identifiers |
Dashboard sprawl | Teams build separate numbers for the same KPI | Publish shared semantic definitions |
The biggest trade-off is speed versus rigor. A warehouse-first approach takes longer to set up than plugging in a dashboard tool. But once the business grows, it becomes the only setup that supports self-serve analytics without chaos.
From Raw Data to Actionable Insights Sample Analyses
The warehouse matters because it lets you answer real questions, not just publish static reporting.

Most valuable ecommerce analysis isn't exotic. It's disciplined joining of customer, order, event, and spend data. The difference is that a mature stack lets you do it repeatedly, with trusted logic, and fast enough to influence decisions this week instead of next month.
Cohort analysis for repeat purchase quality
Start with acquisition cohorts by first order month or first order channel. Then track how those cohorts behave over time: repeat purchase, net revenue, refund behavior, and order cadence.
This analysis answers a question that blended dashboards often hide. Are you acquiring customers who become valuable, or are you renting revenue through discounts and promotions?
A practical cohort model usually joins:
Customer table: First order date, acquisition source, device, geography
Orders table: Order timestamp, gross sales, discounts, refunds
Lifecycle table: Repeat purchase flag, latest order date, current status
The useful output isn't only a retention heatmap. It's the ability to compare cohorts by acquisition source and merchandising strategy. If one cohort converts well on the first purchase but shows weak repeat behavior, your issue may be offer quality or product-market fit, not media efficiency.
Funnel analysis that finds real friction
Funnel work is only reliable when event tracking is clean. You need product view, add to cart, checkout start, payment attempt if available, and purchase completion. Then segment the funnel by channel, device type, landing page, product family, and customer status.
Analytics for ecommerce becomes operational. Funnel analysis tells you whether to fix the landing page, improve product content, simplify cart interactions, or investigate checkout failures.
A useful diagnostic pattern looks like this:
Start broad: Compare funnel progression across major traffic sources.
Isolate context: Break the weak segment by device and landing page template.
Inspect product mix: Check whether the segment is concentrated in certain SKUs or categories.
Validate with customer signals: Review support tickets, returns, and on-site feedback for the same slice.
The best funnel analysis doesn't stop at where users drop. It identifies which team should act next.
Channel analysis beyond platform attribution
Ad platforms are optimized to sell media, not to provide a neutral business view. That's why channel analysis should begin in your warehouse, not in Meta Ads Manager or Google Analytics alone.
A major underserved angle in ecommerce analytics is incrementality and profit-aware measurement. The harder problem is connecting spend to contribution margin and blended performance across fragmented channels, as argued in Improvado's ecommerce analytics guide. That matters because revenue attribution often flatters channels that are good at claiming demand, not creating it.
A stronger channel analysis joins:
Data source | Example fields |
|---|---|
Ad spend tables | Campaign, source, spend, date |
Session or click data | UTM source, medium, campaign, landing page |
Orders | Customer ID, order ID, discount, refund status |
Finance or operations data | Shipping cost, fees, product cost, return cost |
The shift is conceptual. Stop asking only which channel drove revenue. Ask which channel created profitable, repeatable demand after discounts, returns, shipping, and fees.
Review and support signals in the model
Many ecommerce teams miss easy insight. Product and support teams often collect valuable qualitative data that never reaches the warehouse. Reviews, support tags, complaint reasons, and return notes can explain why a cohort churns or why a product gets traffic but stalls in conversion.
If you want to enrich structured analysis with customer language, this guide to sentiment analysis on reviews is a practical reference point. The key is not the model sophistication. It's joining review and support signals back to SKUs, orders, and customer segments so the business can act.
That often reveals the issue faster than another attribution dashboard.
Accelerating Your Team with Self-Serve Analytics
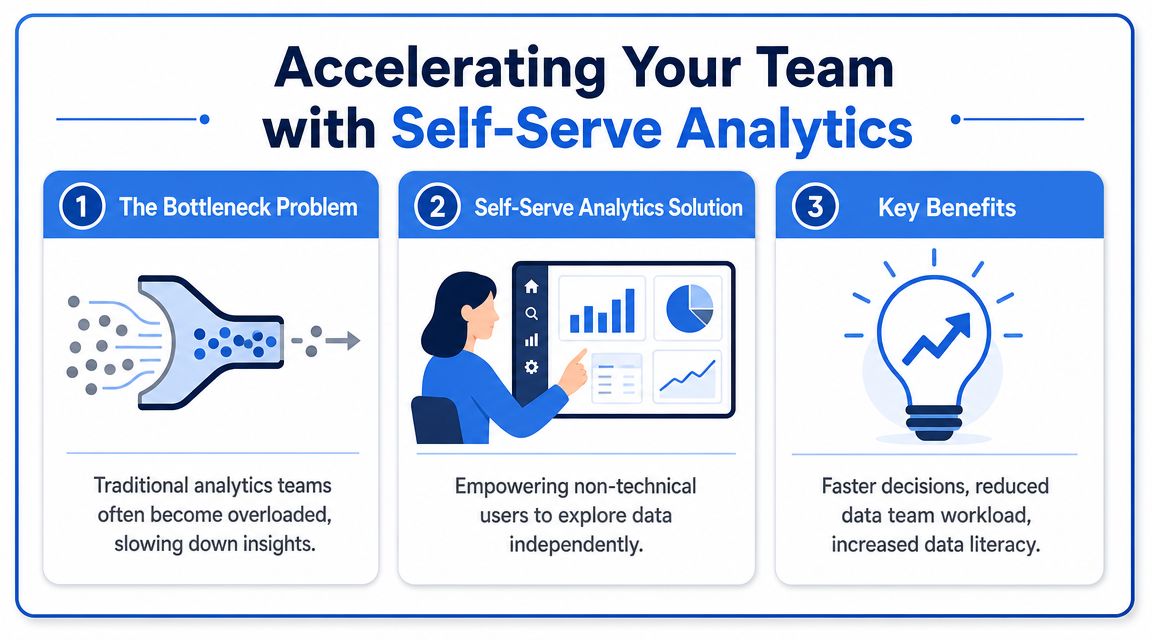
Once the warehouse and data models exist, the next bottleneck appears. Every useful question still lands in the data team's queue.
Marketing wants cohort cuts by campaign theme. Product wants checkout behavior by device. Merchandising wants product interaction by collection. Finance wants net sales logic reflected in the dashboard. None of these requests are unreasonable. They just don't scale through a ticket system.
Why BI alone creates a queue
Traditional BI tools are strong when the question is already known. Build a dashboard for weekly trading. Publish a CAC view. Share a board-level revenue summary. That works.
They become restrictive when the business needs exploratory work. Most decisions in ecommerce don't start with a polished metric. They start with a messy question. Why did conversion fall for returning mobile shoppers on a few top products after a promotion launched? That question often needs SQL, Python, joins, quick charting, and iteration.
This is why many data teams become a human API. Everyone asks for custom slices. Analysts spend their time pulling variants of the same dataset. The warehouse exists, but access to insight is still centralized.
What self-serve should actually look like
Self-serve analytics doesn't mean letting everyone define their own truth. It means giving teams controlled access to trusted models with enough flexibility to investigate.
A practical self-serve setup includes:
Curated warehouse models: Users query trusted tables, not raw source dumps.
Natural-language entry points: Non-technical users can start with plain-English questions.
Notebook flexibility: Analysts and technical users can extend the work with SQL and Python.
Shared outputs: Teams can turn exploratory work into reusable metrics, charts, and reporting assets.
That last part matters most. Good self-serve creates reusable institutional knowledge instead of one-off analyses hidden in someone's laptop.
Tools are starting to reflect that shift. For example, Querio's self-serve analytics approach uses AI-assisted workflows on top of the warehouse with notebook-style analysis, which is a different operating model from purely dashboard-centric BI. The point isn't the brand. The point is the architecture. Self-serve works when it sits on governed warehouse models, not when it bypasses them.
How this unlocks predictive work
Predictive analytics becomes useful only when it changes a business process. Magneto IT Solutions' overview of ecommerce data analytics gets this right. Predictive models should use historical sales, traffic, and customer-behavior data, then feed inventory and campaign planning so analytics changes actions, not just dashboards.
Self-serve helps because predictive work is rarely linear. Teams need to inspect assumptions, compare cohorts, test features, and operationalize outputs. A notebook-friendly environment is better suited to that than a rigid dashboard alone.
Self-serve isn't about removing the data team. It's about moving the data team up the stack, from answering every question to building the system that answers most of them.
Establishing Governance and Scaling Your Analytics Practice
At this point, organizations often have enough infrastructure to create a new mess. Fast access without governance produces conflicting definitions, duplicated dashboards, and low trust.

Governance sounds boring because it is. It's also where mature analytics programs separate themselves from hobby projects.
Define one source of truth
Pick the handful of metrics that run the business and define them centrally. Revenue. Orders. New customer. Returning customer. CAC. AOV. Repurchase rate. Churn if relevant. Publish the logic in a place business users can access.
Don't leave room for "marketing revenue," "finance revenue," and "product revenue" unless those are intentionally different metrics with explicit names. If the same word means different things to different teams, the model is already broken.
A workable metric governance process usually includes:
Metric owner: One accountable person per business-critical KPI
Definition document: Business meaning, formula, grain, exclusions, source models
Change process: How updates are proposed, reviewed, approved, and communicated
Treat quality checks like production systems
Analytics pipelines need tests. Orders shouldn't disappear because an API changed. Refund logic shouldn't double-count without detection. Event properties shouldn't drift without notice.
A strong practice includes automated checks around:
Check type | What you are checking |
|---|---|
Freshness | Source tables loaded on expected cadence |
Volume anomalies | Sudden spikes or drops in events, orders, or spend rows |
Schema drift | New, missing, or renamed fields |
Reconciliation | Modeled totals align with trusted operational systems within agreed logic |
These checks don't eliminate problems. They shorten the time between breakage and detection. That's what preserves trust.
Build habits not just dashboards
Most companies say they want a data-driven culture. Fewer are willing to run the operating cadence that creates one.
Analytics adoption comes from repetition. Weekly trade reviews. Clear owners for KPI movement. Shared definitions in meeting decks. Postmortems that use data instead of opinions. Analysts embedded close enough to operators to understand what decisions the business is making.
The most effective data leaders I know do three things consistently:
They reduce the number of business-critical metrics.
They make definitions easy to find and hard to alter casually.
They force every major performance discussion back to the same trusted models.
That discipline is what makes analytics for ecommerce durable. Without it, the warehouse becomes another place to store disagreement.
Putting Your Ecommerce Analytics Plan into Action
Strong ecommerce analytics isn't one tool, one dashboard, or one hire. It's a system.
The pattern that works is straightforward. Start with a tight set of business KPIs. Capture granular event data across the customer journey. Centralize raw data in a warehouse. Model it into trusted tables. Run analyses that connect behavior, orders, spend, and operational outcomes. Then give teams governed self-serve access so they can answer more questions without waiting in line.
What doesn't work is equally clear. Native reports alone don't scale. Direct-to-dashboard setups create brittle logic. Attribution views without profit context mislead. Self-serve without governance creates metric chaos. BI without notebook-style flexibility traps the organization in a backlog.
The practical trade-off is up-front effort versus long-term speed. A warehouse-first model asks for more discipline early. In return, it provides the business with a capability rarely achieved: the ability to move from reactive reporting to repeatable decision support.
If you're leading growth, product, or data, that's the threshold to cross. Stop treating analytics as a reporting function. Build it as operating infrastructure.
Then your team can spend less time arguing about numbers and more time improving conversion, retention, merchandising, inventory, and channel allocation with confidence.
If your team has the warehouse but still operates like every question needs an analyst, Querio is worth a look. It lets teams work directly on warehouse data through AI-assisted SQL and Python workflows, so analysts can maintain trusted data infrastructure while operators explore answers without waiting on a queue.

