BI in Cloud: The Complete Guide for Modern Data Teams
Explore BI in cloud and learn how it scales, what it costs, and how mid-market teams can migrate safely without losing governance or speed.
https://www.youtube.com/watch?v=HCTF0n0FHmU
published
Outrank AI
bi in cloud, cloud bi, self-service analytics, data warehouse, bi migration
35ea724d-013d-4675-a50d-270b94a2a3d1

You're probably living the usual version of BI in cloud right now, even if nobody on your team calls it that. A founder asks for one trustworthy number, your analyst disappears into Slack threads, the dashboard goes stale after the next product change, and the data team becomes a human API for every ad hoc question that lands in the queue. That's not a tooling problem first. It's an operating-model problem.
Cloud BI works when you treat it as a shift in who owns insight, not just where the charts run. The win is that the business stops depending on one overworked analyst to translate every question into SQL. The catch is that self-service only works if the stack, the permissions, and the modeling discipline are designed for it from day one.
Table of Contents
The Human API Problem Cloud BI Is Built to Fix
A 40-person startup rarely has a data platform. It has a ticket queue with a warehouse attached. The founder wants weekly active users broken out by cohort, product, and channel. Sales wants pipeline by rep. Support wants backlog by issue type. Every request lands on the same two-person data team, and everyone calls it “just a quick question.”
That pattern burns teams out because it turns analysts into translators instead of builders. By the time a dashboard ships, the underlying metric has changed, the business has already moved on, and the same request comes back in a slightly different form. Cloud BI is useful because it gives the business a place to answer routine questions without turning every answer into a one-off service request. If you're trying to reduce that dependency, this internal guide on data democratization strategy is the right companion piece.
The real problem is ownership, not access
Access alone doesn't fix anything. If everyone can reach a dashboard but nobody trusts the metric logic, the company still asks the analyst to arbitrate every number. Cloud BI pays off when you move ownership of recurring insights into governed assets, with definitions that live longer than any one sprint.
That's why the strongest cloud rollouts don't start with a giant dashboard library. They start with one or two questions the business keeps asking, then they make those questions repeatable without analyst babysitting.
Practical rule: if a question shows up in Slack every week, it belongs in a governed workflow, not in a fresh analysis thread.
The shift is cultural as much as technical. Once product managers, operators, and founders can answer common questions themselves, the data team can stop being a human API and start maintaining the system that supports the company.
What Cloud BI Actually Is and How It Is Architected
Cloud BI is business intelligence built to run on cloud infrastructure, with the reporting layer connected to cloud-native storage and compute instead of a fixed on-prem server. In practice, that means dashboards, exploration, semantic definitions, and governance sit on top of a warehouse-first stack rather than inside a closed reporting box.
That matters because the stack is layered. If you do not understand the layers, you buy the wrong tool and blame the wrong bottleneck.
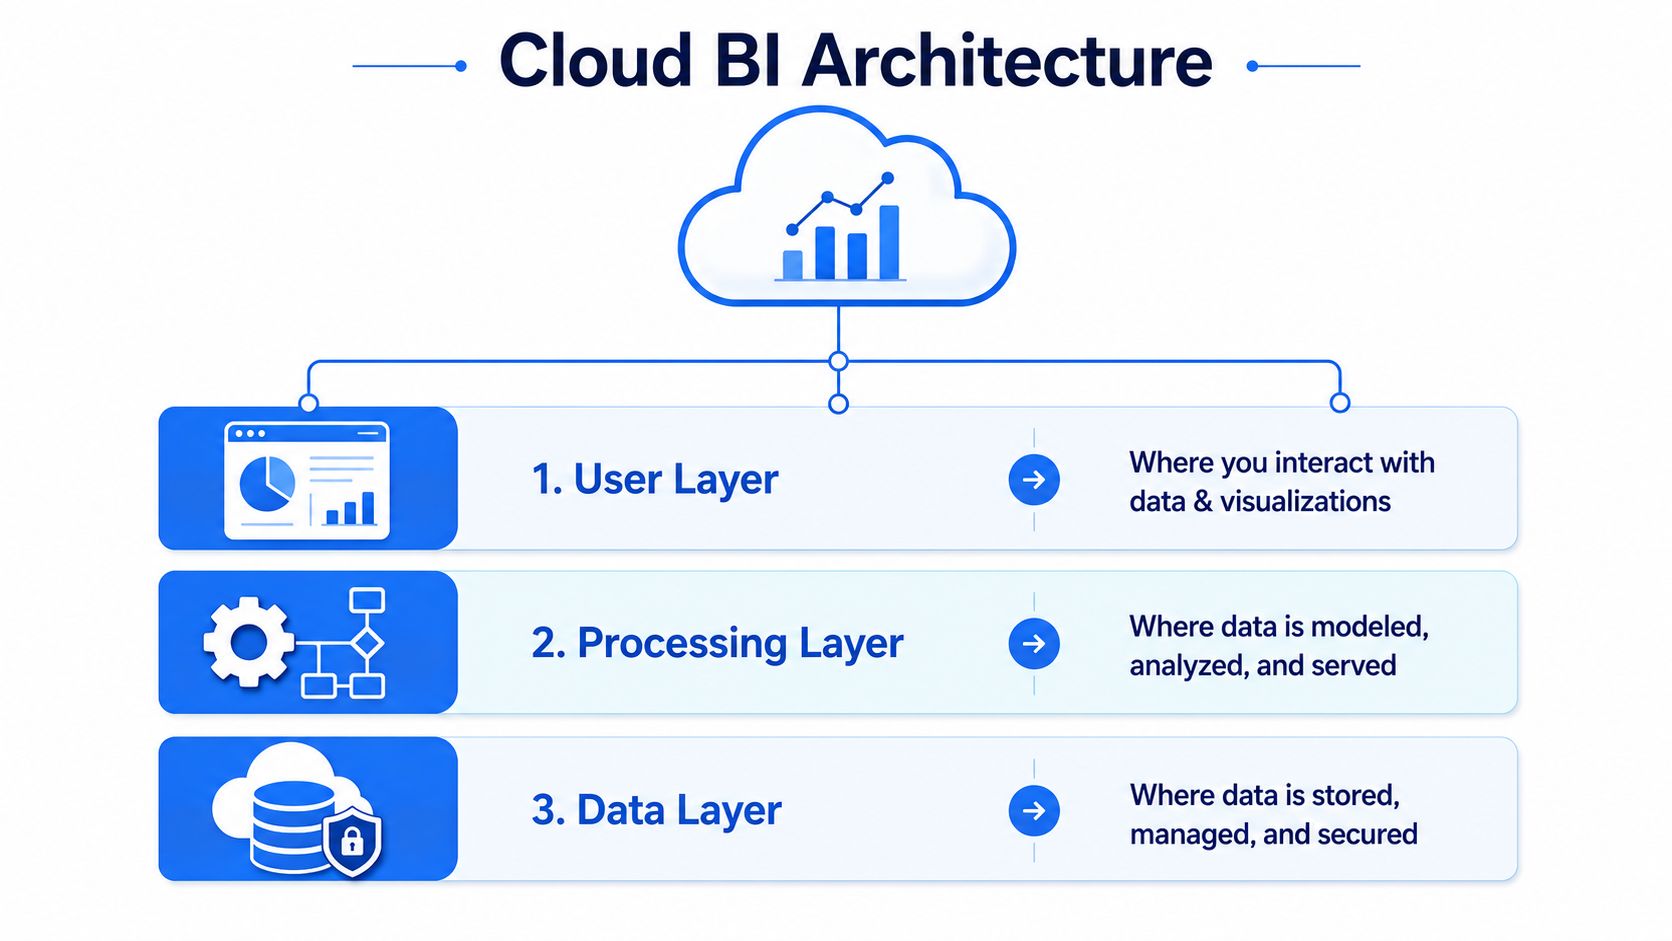
A layered model that keeps compute and storage separate
The stack operates in layers. The data layer is the pantry and cold storage. The processing layer is the kitchen where ingredients get prepped, combined, and plated. The user layer is the dining room where the meal gets served. If the pantry is messy, the kitchen slows down. If the kitchen is overloaded, service collapses. If the dining room looks polished but the kitchen is broken, nobody cares.
Cloud warehouses such as Snowflake, BigQuery, Redshift, and Databricks matter because they let compute and storage scale independently, which is the main architectural difference from older BI stacks. Microsoft's architecture guidance for Power BI follows the same warehouse-first pattern, with ingestion, warehouse, semantic models, and reporting separated into distinct layers, and with BI platforms connecting directly to cloud warehouses so compute can scale without dragging storage or data movement along with it cloud BI architecture guidance. I have seen teams save months of rework by accepting that each layer needs its own design decision.
The mistake is to treat cloud BI as the same dashboards, just in a browser. That only moves the bottleneck. You still need a clean ingestion path, a modeled semantic layer, and reporting that does not force every user into raw SQL. Querio's write-up on data warehouse architectures fits here because the warehouse is where your BI stack stops being a pile of exports and starts behaving like an operating system for analytics.
Self-service only works when the processing layer is designed to absorb real usage, not when every exploratory query waits behind one analyst's laptop.
If you want the short version, cloud BI is not one tool. It is a stack discipline.
Cloud BI Versus On-Premises BI in Real Terms
For mid-market teams, cloud BI wins by default because speed matters more than ceremony. One source cites 3 to 4 months for cloud BI versus 12 to 18 months for on-premise implementations, and that gap matters because the business gets value while competitors are still waiting on infrastructure sign-off deployment speed comparison.
On-premises BI still has a place, but only when the constraint is real. If you operate under a zero-cloud policy or a hard data-residency rule, cloud-first advice is useless. Independent coverage of regulated environments notes that government, defense, and similar organizations may not be allowed to use cloud in the first place, which creates a real deployment gap that generic “just use the cloud” advice ignores zero-cloud gap coverage.
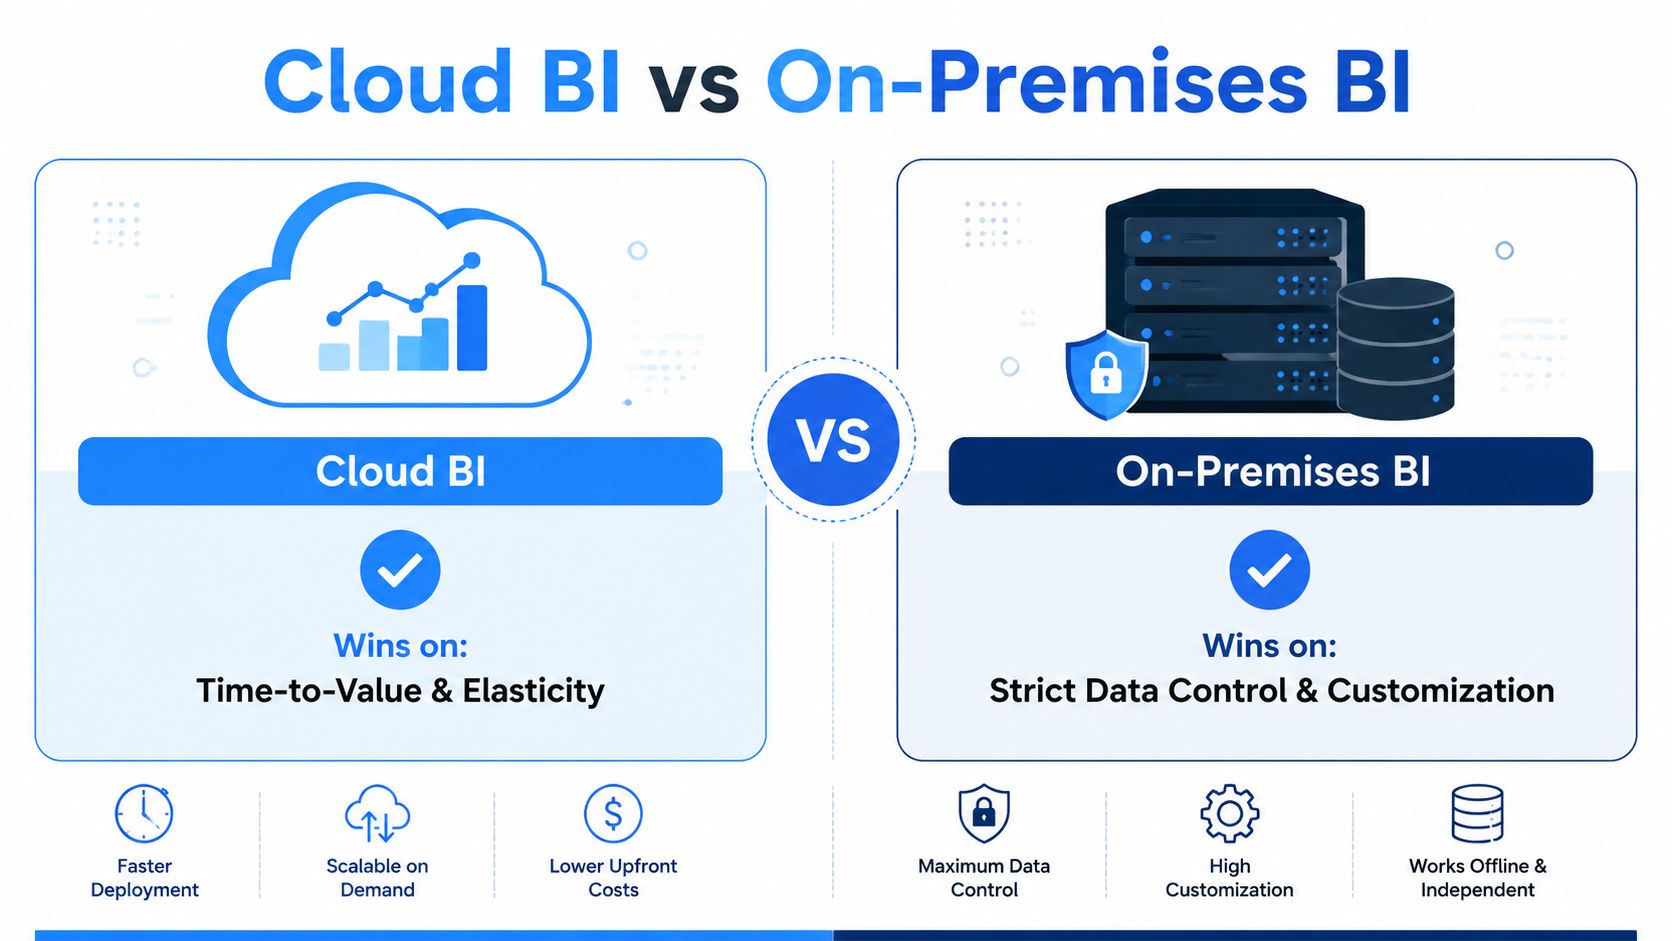
Where each model wins in practice
Cloud BI wins on speed, elasticity, and lower upfront commitment. That is why adoption has kept rising in survey data. One survey found cloud BI usage moving from 5% in 2011 to 28%, and another found adoption climbing from 29% in 2013 to 43% in 2016 cloud BI survey. The point is not popularity for its own sake. It is that teams are choosing an operating model that keeps pace with the business instead of slowing it down.
On-premises BI wins when control is the requirement. You get tighter physical control, more customization room in some environments, and a deployment posture that fits organizations that cannot move data outside a bounded system. The trade-off is operational overhead, slower rollout, and a heavier staffing burden. If your team already knows it needs to run everything inside its own walls, on-premises BI can fit. If that is not your situation, it usually becomes expensive inertia.
Use this filter:
Choose cloud BI when your team needs faster time to value, variable usage, and a leaner operating model.
Choose on-premises BI when policy, residency, or strict control is required.
Do not choose on-premises by habit. That is the default mistake.
The market numbers point in the same direction. Estimates place the global cloud-based BI market at $15.2 billion by 2026, expanding at 22.8% CAGR from 2021 to 2026, while another forecast puts the broader BI software market at $22.8 billion in 2021 rising to $32.856 billion by 2026 deployment speed comparison. Treat those as projections, not guarantees, but they show where buyer behavior is heading.
If you are comparing products, use a real feature matrix instead of vendor slides. This BI tools comparison is more useful than brand hype because it forces you to compare architecture, governance, and day-to-day operating fit.
For mid-market startups, the recommendation is blunt. Start cloud-first unless policy blocks you. Most other reasons for choosing on-premises are really excuses for keeping a legacy operating model alive.
Five Benefits Mid-Market Teams Experience
Cloud BI gets overpromised in vendor decks. The benefits are narrower, more practical, and easier to verify inside a 30-to-200-person company. You see them in the ticket queue, the dashboard backlog, and how quickly new hires can start using data without a long ramp.
That is the right way to judge cloud BI. Treat it as an operating-model choice first, a tooling choice second. Mid-market startups do not have room for a six-month platform team just to keep reporting moving, so the test is whether the stack lowers friction for the people who need answers every day.
What changes for the business
Benefit | What It Means in Practice | Metric to Track |
|---|---|---|
Elasticity | The stack handles spikes in dashboard usage or ad hoc exploration without forcing a redesign. | Dashboard refresh latency during peak usage |
Faster time to insight | Non-technical users get answers without waiting on a manual pull. | Time from question to decision |
Self-service | Analysts stop redoing the same work and focus on modeling and governance. | Percentage of reports owned outside the data team |
Lower upfront commitment | You avoid a heavy early infrastructure build and pay for usage as the company grows. | Cost per active user per month |
AI-ready analytics | Governed data becomes easier to query with coding agents or natural-language workflows. | Number of AI-assisted analyses reviewed and reused |
The first benefit is elasticity. If a new dashboard gets popular internally, cloud BI absorbs the load better than a fixed server-room setup. The second is faster insight, which matters because the business cannot wait through multiple meetings for a weekly number. The third is self-service, and teams either get that foundation right or pay for it later. If the semantic layer is messy, self-service just means more people will hit bad definitions faster.
The fourth benefit is capital discipline. Cloud BI reduces the temptation to overbuild hardware or platform layers before the team knows what it needs. If you are modernizing the stack around this mindset, a warehouse modernization plan is the right place to start, because the warehouse and the BI layer need to move together. The fifth is AI access. Research on cloud BI economics puts governance, monitoring, IAM, and long-term TCO and ROI analysis ahead of rosy sales claims, which is the right framing if you plan to layer AI on top of BI cloud BI economics.
Bottom line: cloud BI does not remove the need for semantic modeling and governance, it makes those disciplines harder to ignore.
A lot of teams miss that part. They buy flexibility, then skip the architecture work that makes flexibility safe. The result is a faster mess, not a better one.
Migration Checklist and Best Practices in One Pass
Treat migration as a controlled sequence, not a big bang. The teams that move fastest do not rip out reporting overnight. They pick one workflow, build the new foundation around it, and keep the rest of the company out of the blast radius until the stack proves itself.
The common technical pattern is simple, separate the layers and size each one on its own. SAP's AWS sizing guidance for BusinessObjects shows that approach clearly, with separate RAM and CPU requirements for the web application, intelligence, processing, and CMS database hosts, plus an example that needed 28 GB total RAM and at least 14 GB for the processing layer alone because adaptive processing servers live there SAP sizing guidance. That is the practical lesson. The processing tier becomes the first bottleneck when analytics turns interactive.
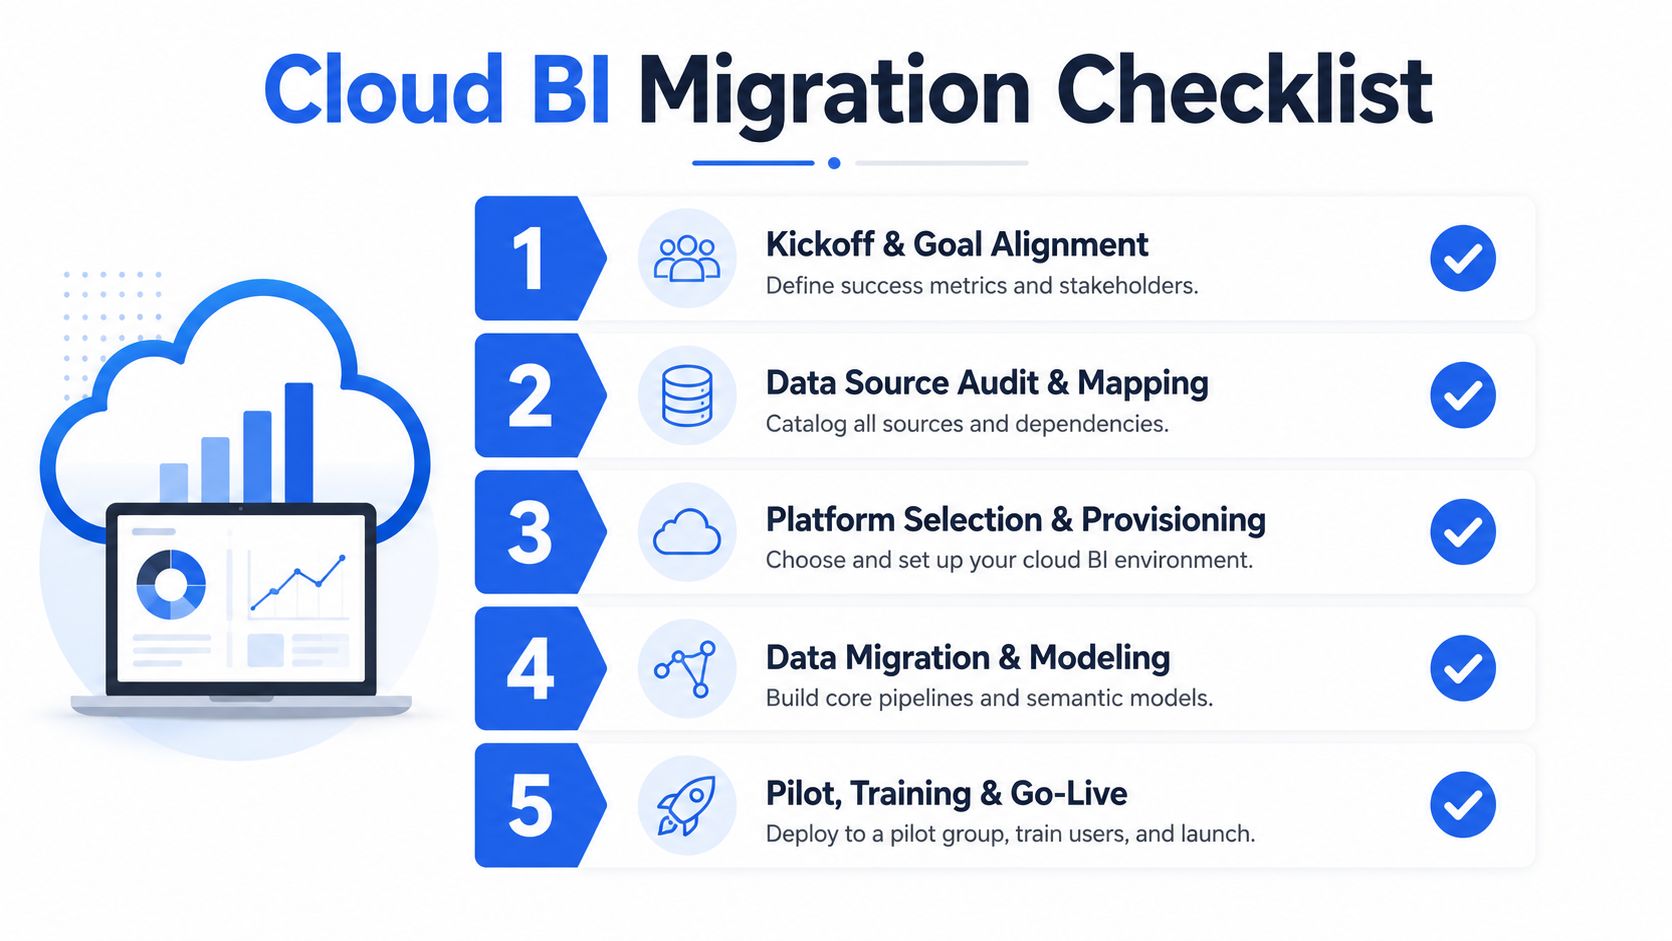
The sequence that works
Kickoff and goal alignment. Decide which business question deserves the first migration. If the team cannot name a clear decision that improves, the project is still too abstract.
Data source audit and mapping. Inventory every source, dependency, and downstream report. Hidden spreadsheets and shadow metrics usually surface here, and they tend to cause the most pain later.
Platform selection and provisioning. Choose the warehouse-native BI layer, then provision access before anyone starts building reports. If you skip identity and permissions now, you will pay for it later in rework and access drift.
Data migration and modeling. Build the semantic layer first, then expose it to users. Row-level security belongs here, not after the pilot group starts poking around. If your stack needs a broader foundation refresh, anchor the rollout to a data warehouse modernization plan so the warehouse and BI layer move together instead of drifting apart.
Pilot, training, and go-live. Launch to a small user group, watch what they do, and only then expand. The goal is not perfect coverage. The goal is trustworthy adoption.
Cloud guidance from Microsoft makes the same architectural point, keep ingestion, warehouse, semantic models, and reporting distinct so compute can scale separately from storage and movement cloud BI architecture guidance. That separation is not academic. It keeps the processing tier from becoming your daily failure point.
Do not call migration finished at launch
I would be wary of any team that calls the project done once the dashboards render. The work starts after launch, because governance, metric ownership, and access review are continuous. If you want the rollout to hold up, use the first release as the beginning of the operating model, not the end of the project.
A useful outside reference for regulated environments is Ollo's BI governance for regulated firms, especially if your buyers need stricter controls than a standard startup team. That governance question matters because vendor features mean little if the data team cannot prove who saw what and when.
KPIs to Track and Vendor Selection Criteria That Hold Up
Measure the rollout like an operator, not like a shopper. A BI project can look busy and still fail if nobody knows whether users can find answers without help. Track a small set of KPIs that tell you whether the system is becoming self-service instead of just becoming prettier.
A useful external reference for regulated environments is Ollo's BI governance for regulated firms, especially if your buyers need stricter controls than a standard startup team. The governance question matters because vendor features mean little if the data team can't prove who saw what and when.
The four KPIs I'd actually put on a dashboard
Time to first insight for a new hire. If a new teammate can't get to a trustworthy answer quickly, your “self-service” story is weak.
Percentage of reports owned outside the data team. This tells you whether domain teams are carrying their own reporting load.
Dashboard refresh latency. If refreshes lag, users stop trusting the system.
Cost per active user per month. This keeps cloud convenience from becoming cost sprawl.
Score vendors on architecture, not branding
Criterion | Why It Matters | What Good Looks Like |
|---|---|---|
Warehouse-native architecture | Reduces duplication and keeps compute close to the source of truth. | Connects directly to your warehouse without unnecessary copies |
Semantic-layer support | Prevents metric drift across teams. | Shared definitions, reusable models, governed business logic |
Governance primitives | Makes access safe at scale. | Permissions, audit trails, and row-level controls |
Extensibility for AI coding agents | Lets technical and non-technical users work from the same governed layer. | Reviewable code generation and reusable analysis workflows |
Total cost predictability over 24 months | Headline pricing is not the same as real cost. | Clear usage model, monitoring, and long-term planning support |
The economics question matters more than most demos admit. Research on cloud BI explicitly warns teams to look past the flexibility story and do long-term TCO/ROI and SLA tracking instead of assuming cloud is automatically cheaper cloud BI economics. That's the right lens for mid-market buyers who can't absorb surprise spend.
My recommendation is simple. Buy for governance and warehouse fit first, then evaluate AI features. If the vendor can't explain how it will control access, preserve definitions, and stay predictable as usage grows, keep moving.
Your 90-Day Cloud BI Rollout Plan
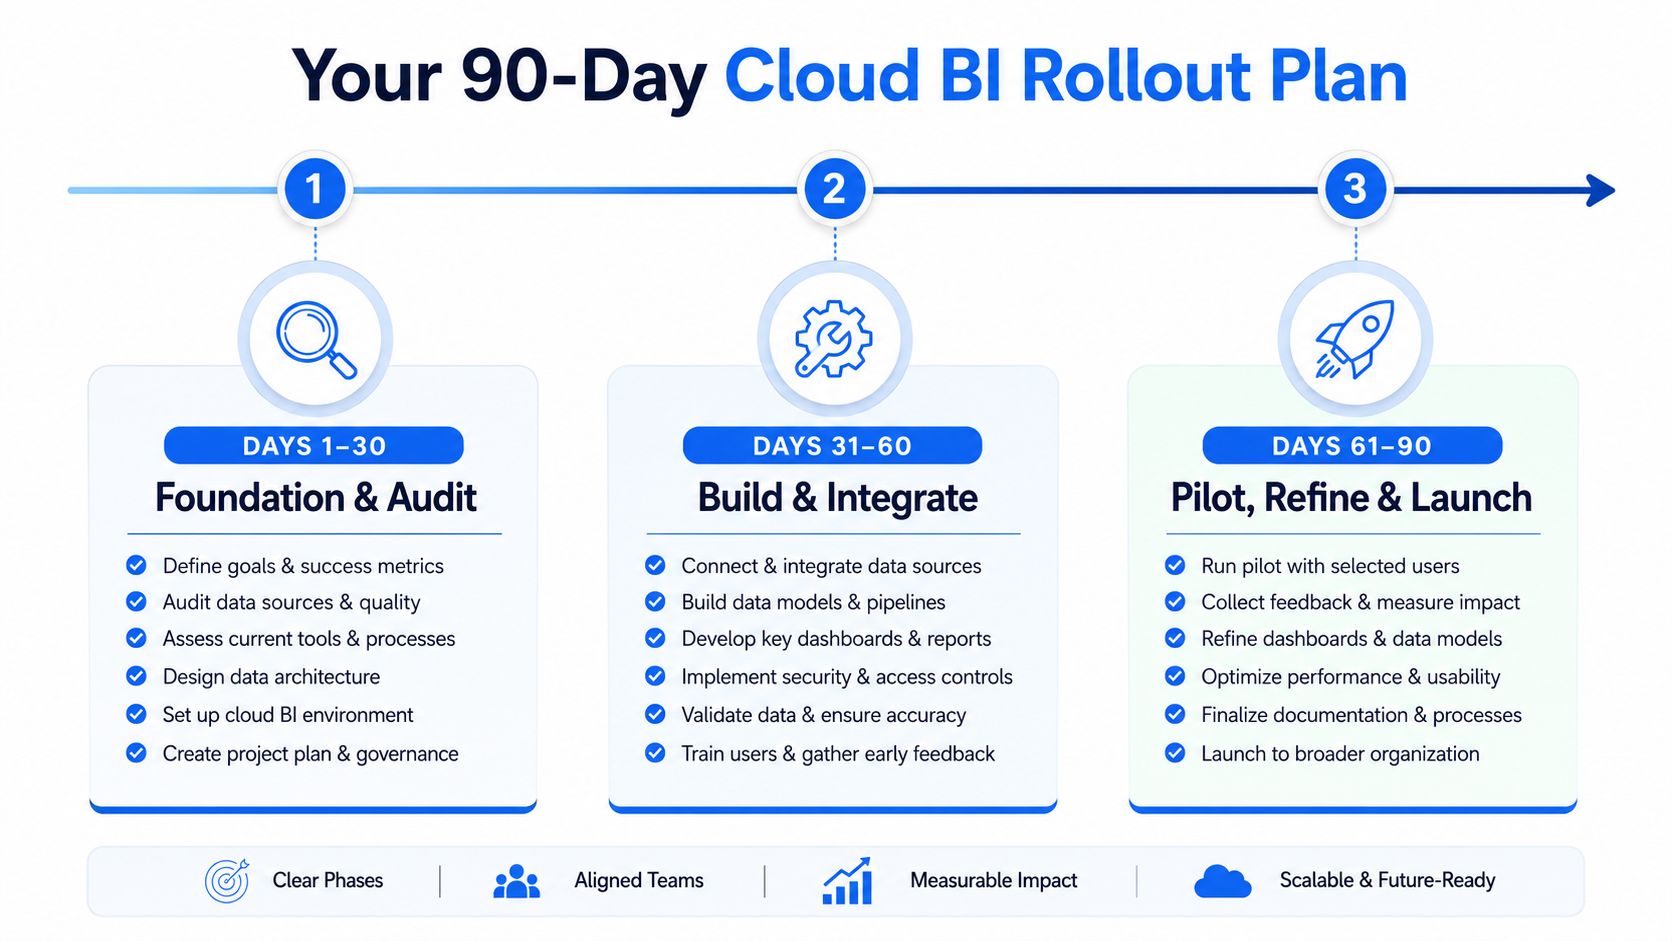
The first 30 days set the operating model. Audit the reports people already trust, pick one high-value use case, confirm the warehouse can support it, and lock the stakeholder group before anyone starts building. If the team cannot agree on the first metric that matters, stop there and resolve that decision first.
Days 31 to 60 are for the build. Define the core metrics, wire in identity and access control, and open the environment to a small pilot group of non-analysts. The pilot should pressure-test the semantic layer and the definitions behind it, not just the dashboard design.
The last 30 days are for rollout and correction. Train the first broader user group, review how the dashboards are being used, fix the metric drift you missed, and run the first KPI check against the targets chosen at kickoff. Cloud BI pays off when requests turn into self-service and the data team owns the system, not every individual answer.
The four KPIs I'd put on a dashboard are the ones that show whether the rollout is working, not whether the visuals look polished. Track adoption by the target users, metric consistency across reports, support requests that still need analyst intervention, and the time it takes to get from question to answer. Those four signals tell you whether the operating model is changing or whether you just shipped another reporting layer.
If you're trying to get out of the human-API trap, Querio gives data teams an analytics workspace that works directly on your warehouse and supports governed, code-backed analysis for both technical and non-technical users. It is built for teams that want BI in cloud to become a durable operating model, not another dashboard graveyard. Visit Querio and see whether that fits the way your team works.

