Business Intelligence Modernization: A Practical Roadmap
A practical guide to business intelligence modernization for mid-market startups. Learn patterns, roadmaps, pitfalls, and tooling choices that work.
published
Outrank AI
business intelligence, BI modernization, data strategy, self-service analytics, AI BI
eb42b511-4f7c-435a-92ca-acc6c1bdd8da

You're probably living this already. A founder pings Slack for one number. The analyst says they need to check the warehouse, reconcile two dashboards, and “clean up one metric definition first.” By the time the answer lands, the meeting's over and the team has already argued about whether the number was right.
That's the problem business intelligence modernization solves. Not prettier charts. Not another dashboard portal. It's about getting your data team out of the business of acting like a human API, so they can build governed analytics once and stop answering the same questions in five different ways.
Table of Contents
What Business Intelligence Modernization Actually Means
You don't need another definition of BI. You need a useful one.
Business intelligence modernization is the move from static, centrally produced reporting to a cloud-based, governed, self-service analytics environment where business users can ask trusted questions without rebuilding logic in every dashboard. That shift matters because it changes the job of the data team from hand-delivering answers to maintaining the system that produces answers.
A modern BI stack does three things at once. It centralizes business definitions, lets non-technical users work from trusted metrics, and keeps the data layer flexible enough for faster iteration. The point is not that dashboards look nicer. The point is that fewer people argue over what “revenue,” “activation,” or “retention” means.
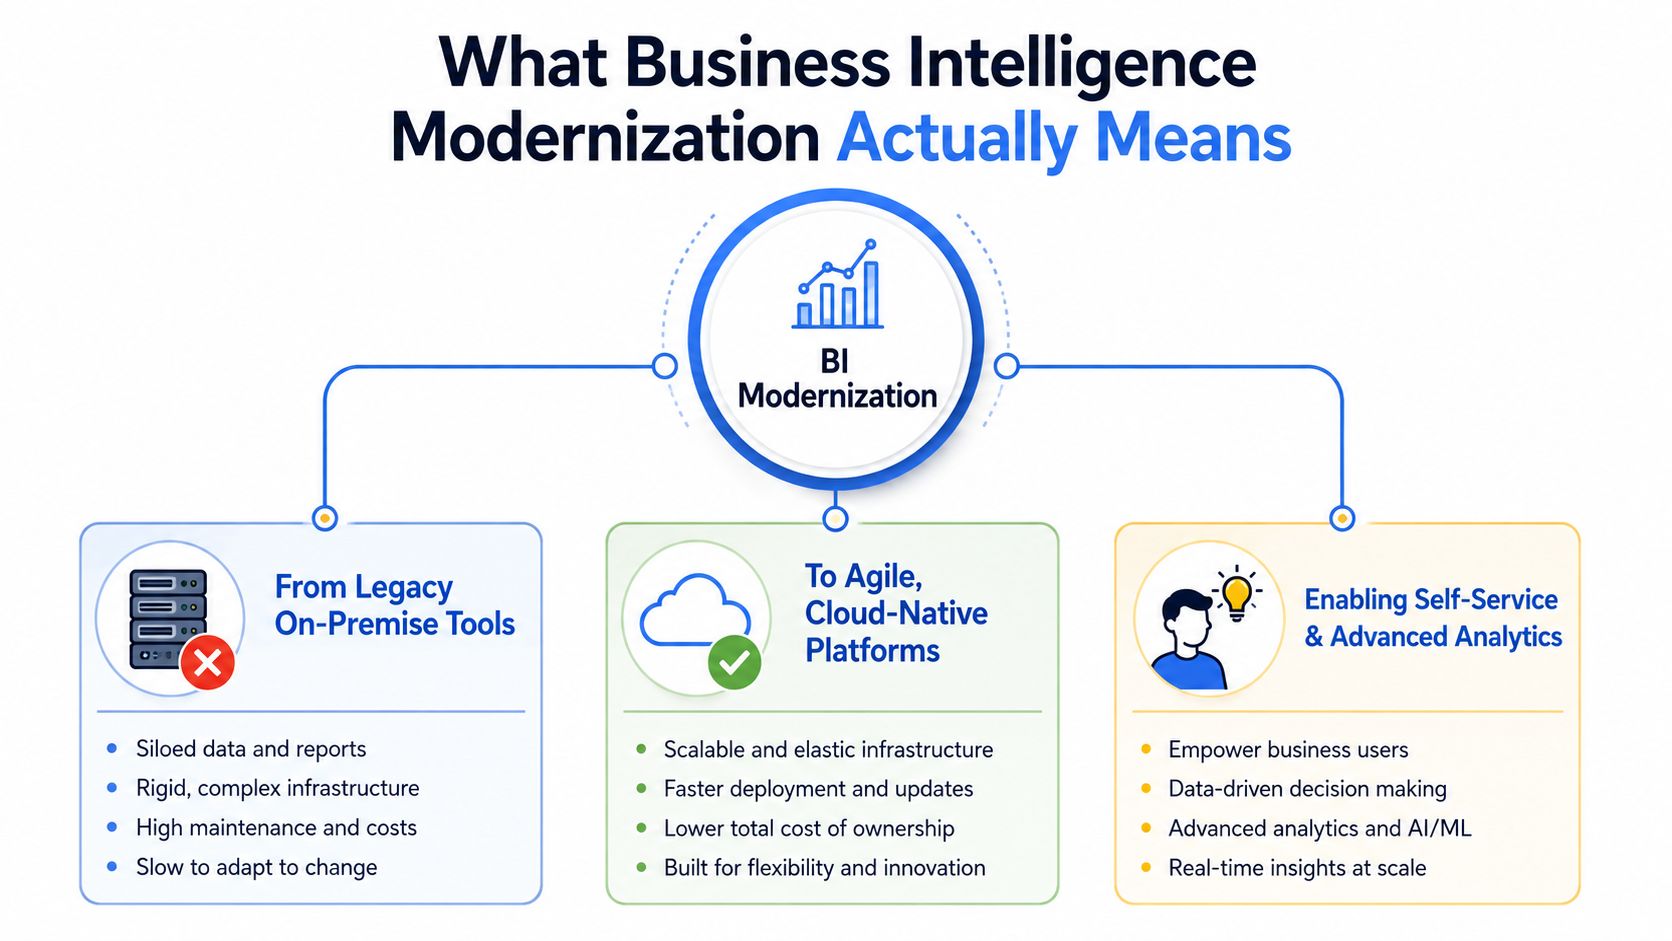
A good reference point for the legacy side of this shift is the way Prometheus Agency frames legacy system modernization. The useful takeaway isn't the vendor angle, it's the discipline. Modernization starts by deciding which parts of the current system still deserve to live.
If you want a clean primer on the analytics layer itself, the internal overview on what business intelligence and analytics are is a solid companion piece. It helps separate the concept of BI from the operating model behind it.
What this actually changes
A founder should care about three outcomes.
First, answers arrive faster because users can query governed metrics directly instead of opening tickets. Second, metric disagreements drop because definitions live in one place. Third, the data team spends less time on repetitive dashboard maintenance and more time on infrastructure, quality, and decision support.
Practical rule: if your team keeps rebuilding the same metric in different tools, you don't have a reporting problem. You have a governance problem.
Modern BI is not a cosmetic refresh. It's a re-architecture of access, trust, and ownership.
Why Modernization Is Now a Board-Level Conversation
This stopped being a niche infrastructure project a while ago. By 2025, more than 78% of global enterprises were reported to have implemented at least one BI or analytics platform, and 84% of executives said BI and analytics are critical to their digital transformation roadmap, according to the industry summary in the brief's reference material. Cloud-based BI also accounted for 65% of total BI deployments in 2025, up from 46% in 2023 in that same summary, which tells you the migration is already well underway rather than theoretical. For broader market context, the same source places the global BI market at $27.11 billion in 2022 and projects $54.27 billion by 2030, with another estimate putting it at $36.82 billion in 2025 and $116.25 billion by 2033. See the summary in this BI statistics reference.
That matters because once BI is ubiquitous, the question changes. It's no longer “Should we have analytics?” It's “How quickly can leadership trust the numbers, and how little does the data team have to babysit them?”
The board now cares about speed, not just access
Legacy stacks create a slow, brittle rhythm. A batch process runs overnight. Someone spots a discrepancy. An analyst explains the discrepancy. Another dashboard gets patched. That may have been acceptable when reporting was a back-office function. It isn't acceptable when product, finance, and growth all expect near-real-time answers.
The internal link on measuring ROI for AI and BI key metrics is useful here because it forces the right question. Stop asking whether dashboards exist. Ask whether they shorten decision time, reduce rework, and cut the number of metric disputes.
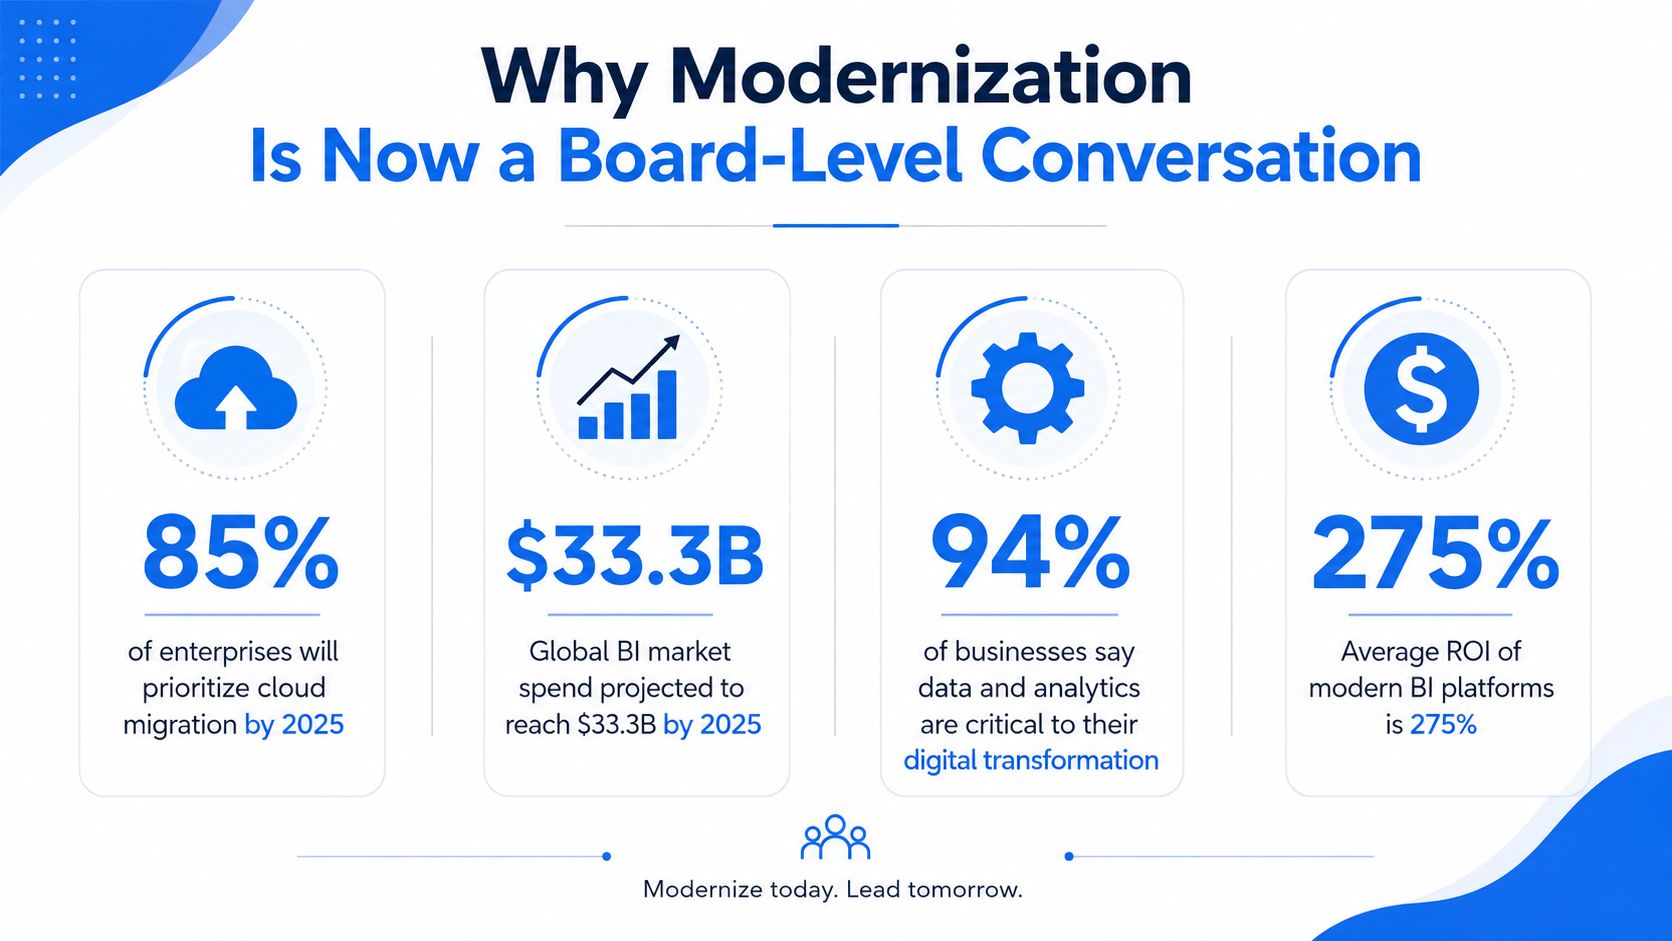
For founders, the implication is simple. If leadership is already expecting faster answers, then a clunky BI layer becomes a hidden tax on every meeting. You end up paying for tools and paying again in lost trust.
If the exec team doesn't trust the dashboard, it will trust the analyst in Slack. That's not scalability.
The Five Core Modernization Patterns
Modernization fails when teams buy a tool and call it a strategy. You do not fix BI by changing the front end alone. You fix it by reducing report sprawl, standardizing logic, and removing the data team from the role of human API for every new question.

The five patterns below build on each other. Skip the order and you will just recreate the same mess in a nicer interface.
The foundation is the cloud data warehouse
Start with a warehouse that can support shared analytics. If data still lives in scattered exports and isolated tools, every report becomes a custom repair job. A startup should replace brittle nightly extracts with a warehouse-native model so product, finance, and operations read from the same base tables, not from separate copies of the truth.
The semantic layer keeps the numbers stable
A semantic layer and governed metadata stop “active customer” from meaning three different things in three different dashboards. Define metrics once, attach lineage and ownership, then let business users query the same business logic without rebuilding it each time. Querio's analytics modernization guide is useful here because it treats this as an operating model problem, not just a tooling decision.
Self-service analytics removes the queue
Self-service works only when the definitions underneath it are clean. Otherwise, you give people a faster way to be wrong. In a real startup, that means a PM checking cohort retention directly instead of waiting on an analyst to export a slide deck, and it means the analyst stops acting like a ticket desk for every recurring question. If you want to see how that shift changes the operating model, explore top enterprise SaaS.
Real-time and streaming analytics reduce staleness
If your business depends on product usage, payments, or marketplace events, stale reporting is a liability. The pattern is straightforward, fresh data moves from batch reports to event-driven views and alerts. A growth team watching a live funnel does not need to wait until tomorrow to react, and the data team does not need to keep re-running the same questions by hand.
AI-augmented workflows cut the manual chase
Text-to-SQL, conversational analytics, and anomaly detection belong near the top of the stack because they compress the time between question and answer. The point is not novelty. AI handles the first pass on exploration, threshold checks, and routing, while humans focus on judgment and exception handling. That only works after the metric layer is clean, because AI just makes confusion happen faster if your definitions are still messy.
My rule of thumb: do not buy AI features until your metric definitions are clean. Otherwise, you are just automating confusion.
The Critical Step Before Choosing a New Tool
Most BI modernization plans start with a tool demo. That is backwards.
The highest-impact move is report rationalization. Before you migrate anything, audit the report estate, retire dead dashboards, merge duplicates, and assign a named owner to every important metric. According to Brillio's note on BI modernization without rationalization, about 30% of the report estate has not been opened in 12 months, which is a blunt reminder that most BI stacks carry a lot of dead weight. If you skip this step, you are just moving clutter into a new system.
A simple scoring rubric that works
Run every report through four questions.
Opened recently? If nobody has touched it in a year, it is probably shelfware.
Decision-critical? If nobody can name the decision it supports, cut it or fold it into something else.
Metric-owner assigned? If the report has no owner, it will drift.
Duplicated elsewhere? If the same KPI appears in three places, you do not have resilience. You have confusion.
That is enough to start. You do not need a six-month governance program to do this well. You need discipline and a willingness to delete work that no longer matters.
Why this comes before tooling
If you migrate a messy report estate into a new stack, you preserve the mess. You pay to rebuild stale logic, duplicate calculations, and orphaned dashboards in a shinier environment. That gives you the worst of both worlds, legacy complexity and cloud subscription costs.
The founder move is to force a reset. Decide what the company needs to know, then modernize only the reports and metrics that still earn their keep. That is also where the data team stops acting like a human API and starts spending time on analysis that changes decisions. If you need a practical place to pressure-test your partner strategy, start by looking at the top BI investors in United States.
A Six-Phase Modernization Roadmap for Mid-Market Teams
A mid-market team does not need a grand transformation program. It needs a sequence that cuts clutter first, then changes the stack. Get the order wrong and you will burn months rebuilding the same confusion in a new system.
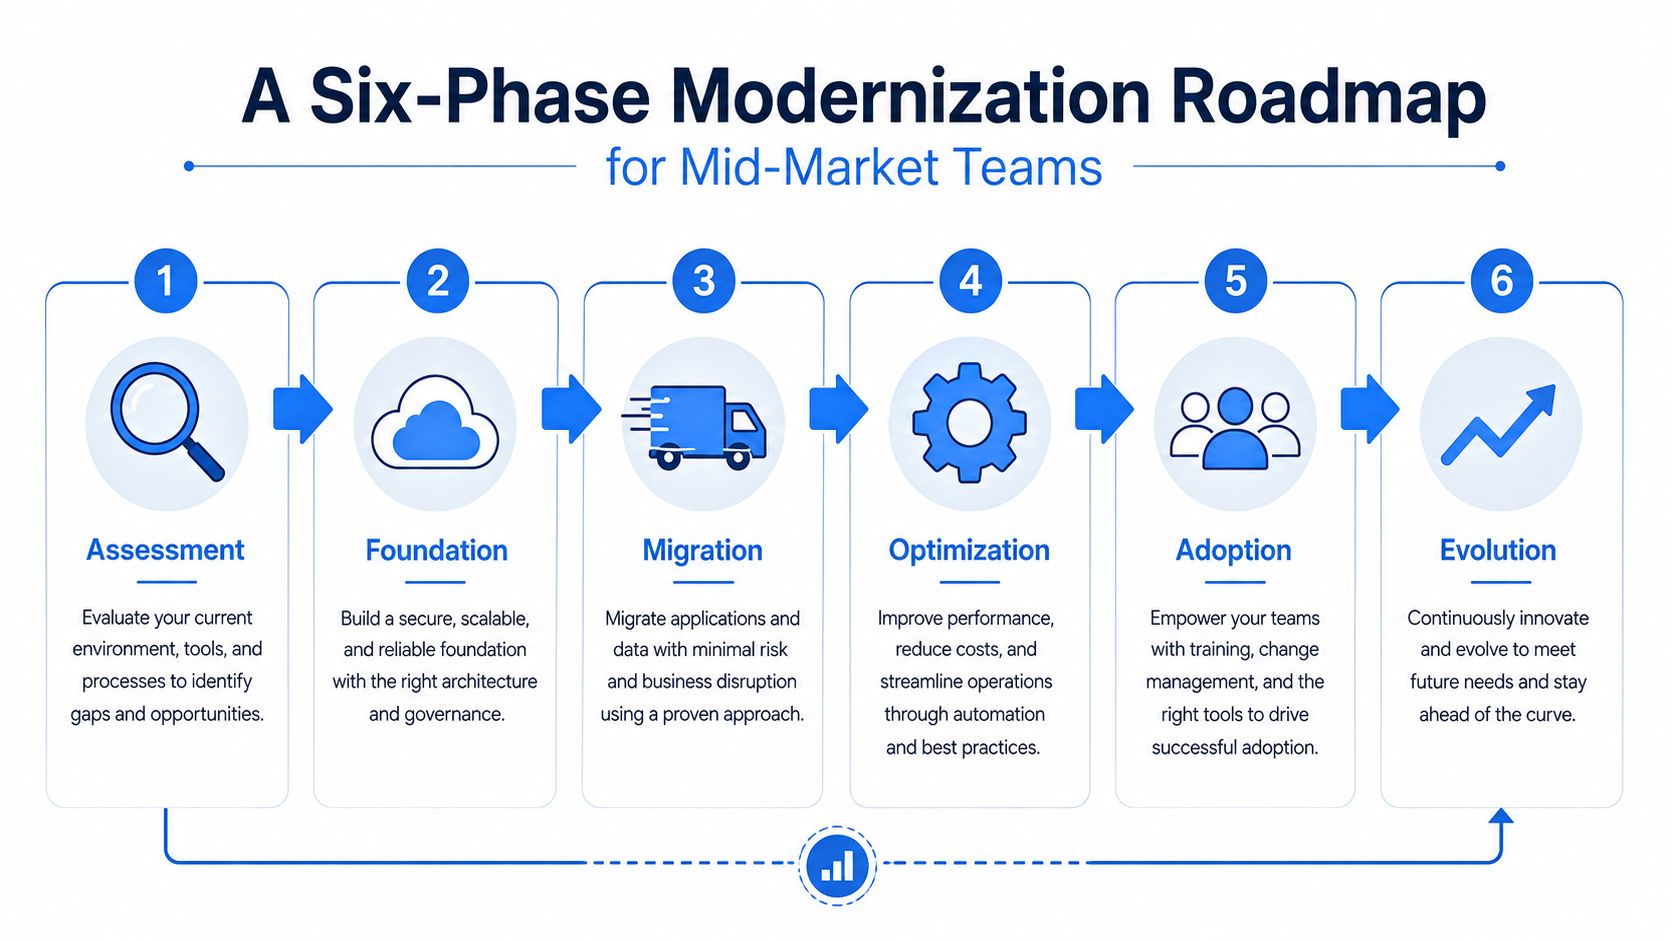
Start with report rationalization. That is the part many teams avoid, and it is the part that frees the data team from being a human API.
1. Assess the current stack and pain
Start with what breaks every week. List the reports that eat analyst time, the dashboards people do not trust, and the workflows that slow leadership decisions. That becomes the modernization backlog.
Look for repetition, stale logic, and reports that exist only because nobody has deleted them. If a metric has three versions, it is already a problem.
2. Choose the foundation
Decide where governed data will live and how people will access it. Buy the pieces that reduce maintenance and standardize definitions, especially around security, connectivity, and shared metric logic.
The wrong move is building a fragile custom stack just because the team wants control. Control without clarity turns into more support work for the data team.
3. Set governance and ownership
Metric ownership has to be explicit. Every important KPI needs a clear owner, a definition, and a home. If ownership stays fuzzy, the stack will drift no matter how polished the interface looks.
Tie each report to a business decision. If nobody can say who uses it and why, it should not survive the reset. For a practical frame on how this cleanup connects to broader data platform work, the warehouse modernization guide is a useful reference point.
4. Redesign the team's roles
Analysts should curate metrics and investigate anomalies, not spend their week exporting the same chart in different formats. Data engineers should protect pipelines, contracts, and freshness. Founders and PMs should get governed self-service access for the questions they ask every week.
That role split matters because it stops the data team from serving as a request queue. The team should spend time on decisions, not copy-paste.
5. Migrate in waves
Do not do a big-bang cutover. Move the highest-value, lowest-chaos workflows first, then expand outward. If you already rationalized reports, this step gets much easier because you are moving a smaller, cleaner estate.
Keep the first wave tight. Choose the reports leadership uses, move them cleanly, and leave the rest until the new operating model is stable.
6. Measure adoption and decision speed
A new BI layer is not finished when the dashboards render. It is finished when teams use it without leaning on the data team for every answer. If adoption is low, the stack is still too complex or the report set still needs more cleanup.
Measure whether people are getting answers faster and whether analysts are spending less time on repetitive requests. That is the test.
Tooling and Operating Model Choices That Actually Fit
Many teams overthink the BI tool and underthink the operating model. That's a mistake. The tool only matters after you've decided who owns metrics, who writes logic, and who is allowed to ask questions directly.
Traditional BI suites still make sense when your world is centralized and slow. They're less useful when your founder, PMs, and ops leads need fast answers without opening tickets. Semantic-layer-first systems are better when consistency matters more than chart variety. AI-native workspaces go further because they let users query warehouse data directly while still staying inside a governed structure.
The shift is in team behavior. Analysts stop being report factories and become metric curators. Data engineers focus on reliable pipelines and contracts. Business users stop filing requests for every minor question and start using governed self-service.
What to drop from legacy BI thinking
Dashboard-first design: If you start with charts, you'll recreate old habits.
One-off metric logic in every report: That's how trust dies.
Analyst as request desk: That's a bottleneck, not a model.
Tool sprawl: Multiple BI layers just multiply inconsistency.
A useful place to look when evaluating the category is explore top enterprise SaaS, not because you need a shopping list, but because mature enterprise SaaS products tend to reveal where operational expectations are heading.
If you want one opinionated recommendation, here it is. For a mid-market startup, consolidate on a single AI-native analytics layer that sits on top of the warehouse and governed semantics. Don't bolt another dashboard onto a legacy stack and call it modernization. That just creates a second place for the same problem to live.
Two Compact Case Examples From Mid-Market Startups
A Series B SaaS team had the usual pileup, duplicate pipeline dashboards, a finance report nobody trusted, and product managers waiting on analysts for every retention question. They started by killing dormant reports, then standardized core metrics through a semantic layer, and then exposed a natural language interface for common product questions. The trade-off was giving up some dashboard freedom in exchange for consistency, but the result was that analysts stopped translating the same numbers over and over.
A growth-stage marketplace took a different path. It dropped a legacy BI tool and moved to a warehouse-native analytics workspace so the data team could focus on revenue-critical pipelines instead of maintenance work. The trade-off was a short adjustment period for business users who were used to old dashboards, but the gain was a cleaner operating model and fewer interruptions for the data team. If you're comparing who tends to fund this kind of transition, the top BI investors in the United States page is a decent market map, even if your real decision is operational rather than fundraising-related.
Both examples follow the same pattern. Delete unnecessary reporting, standardize the metric layer, and give people a governed way to self-serve. That's the modernization play.
Pitfalls, Costs, and the First 30 Days After Reading This
The failures are predictable. Big-bang migrations drag on. Semantic layers rot when nobody owns them. AI features get treated like a substitute for governance. Metric ownership gets written down once and ignored.
Treat this as a six- to twelve-month operating expense, not a one-time license purchase. The work is part architecture, part cleanup, part behavior change. The companies that rush it usually end up paying twice.
For the next 30 days, do four things. Audit the report estate, name owners for your top metrics, pick one painful workflow to migrate first, and decide whether your next analytics hire is a curator rather than a producer. That's enough to stop the bleed and start building a system your team can use.
Querio helps teams move from analyst bottlenecks to governed self-service on top of the warehouse. If you're ready to modernize BI without turning your data team into a ticket queue, visit Querio and see how its AI-native workspace fits this operating model.

