Business Intelligence with Python: A 2026 Data Team Guide
Master business intelligence with Python end-to-end workflows, essential libraries, and self-serve analytics scaling for your organization in 2026.
https://www.youtube.com/watch?v=I5vZbisPvws
published
Outrank AI
business intelligence python, python data analytics, python BI workflows, self-serve analytics, python dashboards
27ce3643-66f5-41f1-9dab-87382094585e
Most advice about business intelligence with Python skips the critical decision. It treats Python like a universal upgrade, when in practice it's often the wrong first tool for BI, and sometimes the wrong tool entirely. In a mature stack, Python earns its place only when SQL and a dashboard layer stop being enough, not when a team wants to signal sophistication.
That distinction matters because BI work is usually about reliable, repeatable answers, not clever notebooks. Python becomes operationally valuable when teams need reproducible analytics pipelines, custom statistical logic, or advanced shaping that sits awkwardly inside a drag-and-drop tool. It also becomes valuable when the same workflow must move from raw warehouse tables to a standardized output without forcing analysts to copy steps by hand, which is exactly why many BI workflows now pair SQL with Python rather than replacing SQL outright. For a concise framing of that trade-off, see this SQL versus Python comparison for BI teams.
Table of Contents
When Python Belongs in Your BI Stack
Python belongs in BI when the question is not just “what happened?” but “why did it happen, what might happen next, and how do we automate the answer?” That fits the broader split between descriptive, diagnostic, predictive, and prescriptive work, where Python becomes strongest once reporting turns into statistical methods, modeling, and machine learning (Databricks).
The inflection points that justify Python
A clean rule helps. If the task is standard KPI reporting, governed metric definitions, or a non-technical stakeholder building filters and charts, a traditional BI tool usually does the job. If the task includes hypothesis testing, custom transformations, forecasting, classification, or feature engineering that has to run the same way every time, Python starts to earn its keep.
Python also fits the point where analysts need code-based workflows that stay reproducible across warehouse extracts, notebooks, and published outputs. Many BI learning paths pair Python with SQL for querying, analysis, and visualization, and Power BI documents Python as one of the supported ways to run code inside the desktop experience for sourcing, transformation, and visualization (BI analyst workflow materials). Python is not the default reporting layer. It is the layer that makes the report generation process more reproducible and more flexible when the logic gets messy.
Practical rule: if a stakeholder can describe the output as a dashboard tile, Python is probably optional. If they describe the logic as a sequence of transformations, tests, or model steps, Python is probably justified.
Where teams overuse it
The common failure mode is using Python for work that a governed BI semantic layer or SQL view could already handle. That adds notebook maintenance, package management, and code review overhead without improving decision quality. It also shifts the burden from “can the dashboard answer this?” to “can one analyst keep this script alive?”
Python works best when it sits between warehouse data and a durable downstream artifact, not when it replaces every BI need. If the team cannot explain the maintenance gain, the extra complexity is usually not worth it. For a practical comparison of that boundary, this SQL versus Python trade-off for BI teams is the better lens.
The Python BI Technical Foundation
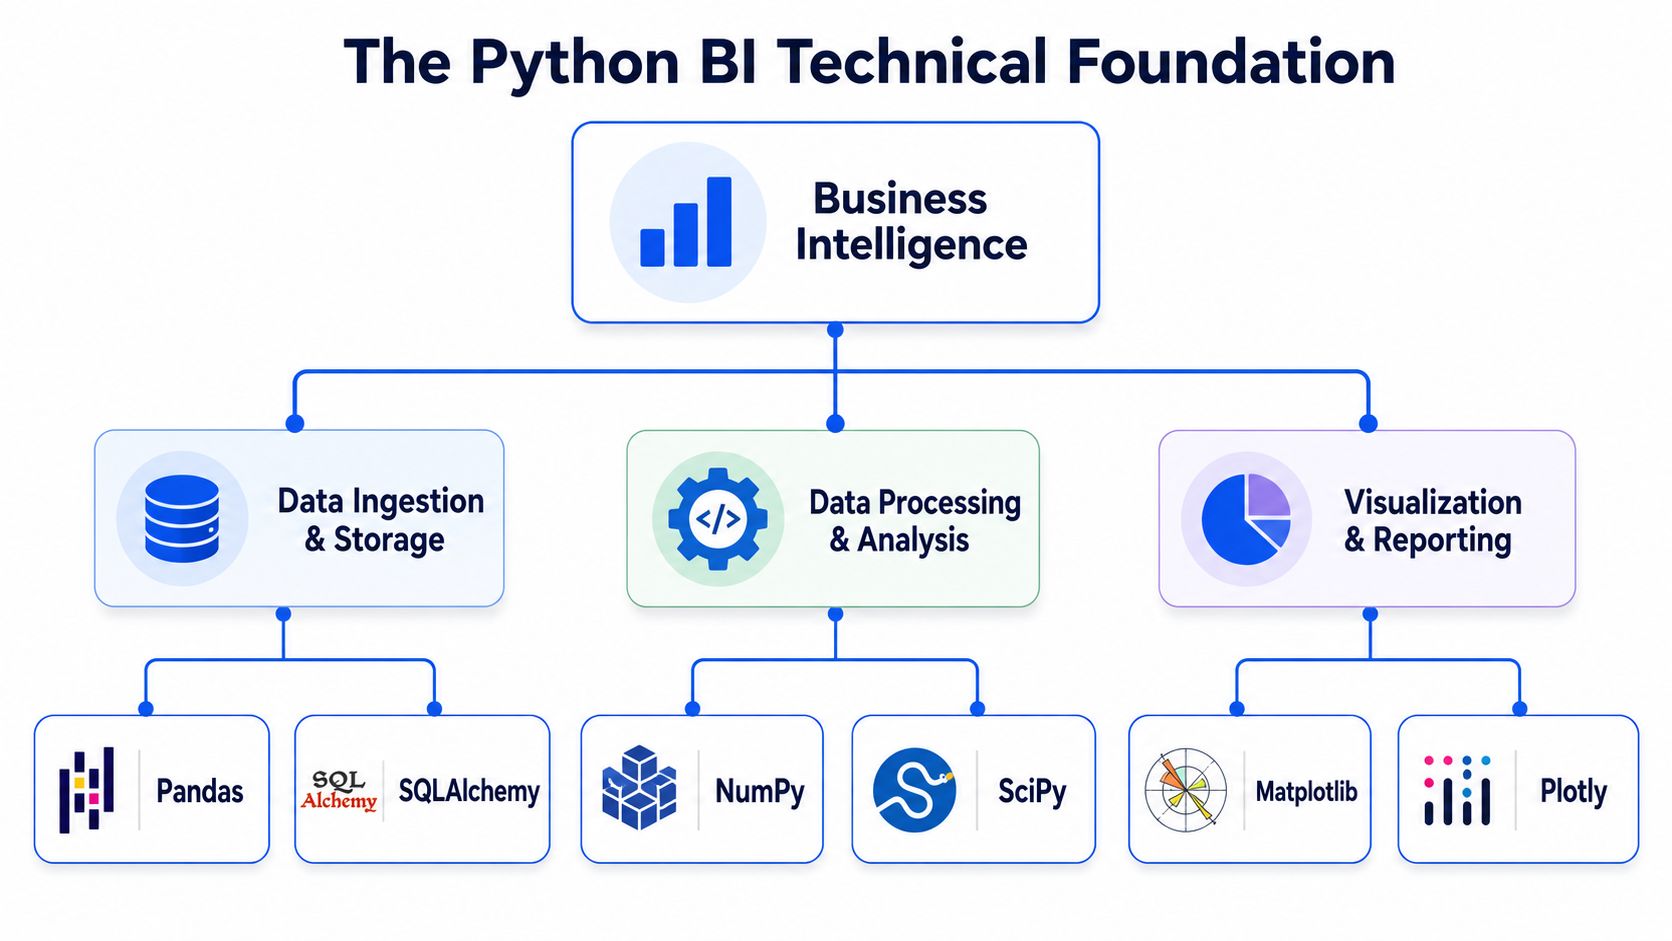
The technical stack behind business intelligence with Python is no longer experimental. The core libraries are now standard tools, with pandas for wrangling, NumPy for numerical work, SciPy and statsmodels for statistical analysis, and scikit-learn for modeling, as shown in a historical comparison of Python against commercial stats packages. That stack is what moved Python from a niche alternative to commercial statistics packages into a mainstream BI language.
How the stack fits together
Pandas is the operational core because BI teams spend most of their time cleaning, joining, reshaping, and aggregating tabular data. In a typical workflow, analysts load warehouse extracts, handle missing values, standardize data types, and group transaction rows into monthly or segment-level summaries. That pattern is especially useful for revenue reporting, cohort analysis, and customer segmentation, where raw event tables are too granular to serve directly. The same workflow is illustrated in a pandas workflow example.
NumPy supports the numerical side of that work, especially when calculations need to be vectorized or standardized. SciPy and statsmodels matter when the BI question needs statistical treatment rather than only descriptive aggregation. scikit-learn enters when the output needs prediction or classification, not just explanation.
For visualization, Matplotlib still matters for precision and compatibility, while Seaborn is useful for exploratory statistical charts. For interactive delivery, Plotly and Dash give teams a path from notebook analysis to shareable, interactive experiences. The point is not to use every library. The point is to keep the work in one language so the same notebook can move from a cleaned warehouse extract to an analysis artifact without a context switch.
The operational part people skip
Environment control is where many Python BI projects fail. A notebook that works on one analyst's laptop can break on another machine if package versions drift or dependencies collide. Teams that want Python BI to survive should standardize environments, pin versions, and keep notebooks close to the warehouse so data access does not depend on local downloads or manual exports.
Operational takeaway: a Python BI stack is only useful when the code is reproducible, the environment is controlled, and the notebook can be rerun by someone other than its author.
A practical workflow starts with a clear sequence for loading, cleaning, testing, and publishing analysis. The Python analysis workflow guide is useful for teams that need a structured reference for that process.
Building End-to-End Python BI Workflows
A good Python BI workflow starts with warehouse data and ends with something another team can trust without opening the notebook. That means extraction, cleaning, transformation, analysis, visualization, and deployment all need to be treated as separate steps, even if they live in the same file. A workflow that only works interactively in a Jupyter cell is not production BI.
Start with extraction, not copying
Pull data with SQL from the warehouse first, then bring only what you need into Python. That keeps the notebook focused on logic instead of becoming a dumping ground for massive extracts. If you are using SQLAlchemy or a warehouse connector, the goal is to return a dataset that is already scoped to the right grain, date range, and business entity.
A simple pattern is to query transactional data with SQL, then use pandas to convert timestamps, standardize categories, and create analysis-ready fields. This is also where you handle missing values and inconsistent types before they distort the aggregation layer. Power BI's Python integration even documents advanced cleansing and shaping in the query layer, including a fillna(method='backfill') example for sparse values and delayed ingestion scenarios (Microsoft Python in Query Editor).
Structure notebooks for reruns
Parameterization is the difference between a useful notebook and a one-off analysis. A monthly revenue notebook should accept a start date, an end date, and maybe a segment filter. A cohort analysis notebook should take acquisition period, retention window, and region. That makes the same logic reusable across stakeholders without creating copy-paste variants.
For example, a monthly revenue flow might look conceptually like this:
Extract: query orders for a fixed period.
Clean: convert dates, normalize currency fields, remove obvious duplicates.
Aggregate: group by month and customer segment.
Visualize: chart revenue trend and segment contribution.
Publish: export the result to a dashboard or scheduled report.
That same structure works for customer segmentation and simple classification tasks. The notebook becomes the computation layer, while the dashboard becomes the presentation layer. In practice, that separation reduces ad hoc analyst work because the logic lives in one place.
Make outputs usable
A notebook that produces a chart isn't enough if stakeholders can't access it reliably. Dashboards, scheduled exports, and shared reports give the output durability. If your team needs a reference point for how Python-based dashboards fit into that pattern, the Dashboards in Python guide is a practical starting place.
The production habit is to treat the notebook like code, not like a scratchpad. Version the file, document the inputs, and keep the output shape stable enough for downstream users to depend on.
Python BI Versus Traditional BI Tools
Traditional BI tools and Python solve different problems, even when they sit in the same stack. Power BI, Tableau, and Looker work best for governed reporting, self-service exploration, and fast charting for business users who do not want to write code. Python is stronger when the work needs custom logic, deeper statistical treatment, or tight control over the transformation layer.
Criteria | Python BI | Traditional BI Tools |
|---|---|---|
Data transformation | Strong for custom cleaning, reshaping, and advanced logic | Strong for standardized modeled data, less flexible for edge cases |
Statistical analysis | Strong for hypothesis testing, modeling, and advanced analysis | Limited, usually focused on reporting and visualization |
Self-service for business users | Weaker unless wrapped in an app or dashboard layer | Strong, especially for drag-and-drop exploration |
Governance of metric definitions | Requires discipline and code review | Often better out of the box with semantic layers |
Custom workflows and write-back | Strong if built into the Python stack | Usually limited or requires separate products |
Maintenance burden | Higher, because code, environments, and notebooks need control | Lower for routine reporting, higher for vendor-specific complexity |
Machine learning integration | Natural fit | Usually peripheral or add-on based |
Where traditional tools still win
Traditional BI tools reduce friction for finance, operations, and sales teams that need to explore data without writing code. They are also a better fit for organizations that want a clear semantic layer, predefined metrics, and a front end that can be used with minimal training. If the requirement is, “show me the funnel by region and let me filter by rep,” Python is usually unnecessary.
Power BI has a strong drag-and-drop reporting model, wide connector coverage, and a familiar Microsoft ecosystem fit. Looker emphasizes governed analytics through a semantic layer and Git-based model management. Tableau remains strong for visual exploration and charting that analysts can shape quickly. Those tools are still the better choice when the team's job is mostly read-only reporting or governed self-service.
Where Python wins
Python is the better choice when a BI question touches production data quality, custom statistics, or model-backed decisions. It also works better when one language must cover analysis and automation, especially if warehouse data needs to feed a repeatable notebook, then a chart, then a downstream workflow. A Python-first stack can create unnecessary complexity if the team does not have code review, environment control, and clear notebook ownership.
For teams deciding between a warehouse-native stack, Python notebooks, or hybrid reporting layers, Querio is one option because it combines SQL and Python workflows directly on warehouse data. That setup makes the trade-off explicit, Python for deeper analysis, BI surfaces for consumption.
Scaling Python BI Beyond Small Datasets
Python BI breaks down most often at the seam between a clever notebook and an organization-wide system. The notebook works for one analyst, one query, and one file. Then the team grows, the dataset gets bigger, and the same script becomes a fragile dependency only one person understands. A vendor-neutral critique of inline BI Python integrations makes the same point, noting that these patterns often fit small data sets and small business problems rather than production-scale machine learning or heavy transformation workloads (Pyramid Analytics critique).
Treat governance as part of the workflow
The fix is not more scripting, it's more discipline. Version control notebooks and scripts in Git, require reviews for changes to core transformations, and keep environment files pinned so reruns behave predictably. If a report matters enough to trigger an executive decision, it matters enough to be reproducible.
Documentation should live next to the code. Analysts need to know where the data comes from, what assumptions are baked into the logic, and which outputs are safe to reuse. Without that, the original author becomes a bottleneck every time a stakeholder asks for a variant of the same analysis.
Design for warehouse-native scale
Large datasets expose memory limits quickly, especially when people try to pull everything into a notebook at once. The more sustainable pattern is to aggregate in the warehouse, then use Python for the part of the logic that needs it. That keeps compute closer to the data and avoids turning a notebook into a replacement ETL system.
Python BI scales when the warehouse does the heavy lifting and Python handles the logic that SQL can't express cleanly.
That's why governance and warehouse design belong in the same conversation. If the warehouse layer is clean, Python notebooks can stay focused on analysis instead of acting like a shadow data platform. For teams tightening that foundation, the warehouse best practices guide is worth reading alongside the notebook strategy.
Real-World Python BI Use Cases
Python earns its place fastest in BI when the business problem needs analysis beyond thresholds and bar charts. That usually means the team needs a model, a statistical test, or a repeatable calculation that traditional dashboards can display but not create. The use cases below are where Python feels like an operational advantage rather than a novelty.
Customer value and retention analysis
Customer lifetime value modeling is a strong fit because it starts in SQL and finishes in Python. The warehouse gives you order history, renewal data, and account attributes, while Python can handle survival-style analysis, cohort logic, and richer segmentation. That's useful when the finance or growth team needs something more nuanced than a simple average revenue per account report.
The business value is not the model itself. It's the ability to encode assumptions in code so the same logic can be rerun when the data updates. That makes the analysis easier to defend in front of leadership because the path from source data to metric is visible.
Recommendation and anomaly workflows
Recommendation systems and anomaly detection also fit naturally because the BI layer can surface the output while Python does the heavy lifting. A product team might use collaborative filtering to generate ranked suggestions, then present the results in a dashboard for product managers or account teams. A finance team might use statistical detection on revenue or margin movements instead of relying on static thresholds that miss context.
A simple rule applies here too. If the output depends on similarity, distribution shape, or learned behavior, Python is usually the right engine. If the output only needs a fixed rule, a BI filter or SQL view may be enough.
Experiment analysis that goes past p-values
A/B testing often gets flattened in dashboards when the question is practical significance. Python lets analysts compute segment-level effects, confidence intervals, and guardrail comparisons in one place, then publish only the conclusion the business needs. That's a better operating model than throwing raw test metrics into a chart and hoping the audience interprets them correctly.
The video format helps here because some stakeholders absorb the logic faster when they can watch the workflow rather than read the notebook. That's especially true for teams that are still deciding whether Python belongs in the BI stack at all.
Adopting Python BI in Your Organization
The easiest way to get Python BI wrong is to launch it as a universal standard. The better approach is staged adoption, with the stack shaped by team maturity, governance needs, and who consumes the output. A startup can move fast with notebooks. A scale-up needs version control and shared conventions. An enterprise needs policy, review, and integration with existing BI systems.
Match the adoption path to the team
At startup stage, speed matters more than process, but even there, one metric should be owned clearly and rebuilt consistently. At scale-up stage, Git, automated reporting, and team training stop being optional because one-off notebooks multiply fast. At enterprise stage, governance policies and integration discipline matter more than raw flexibility.
That's why a practical roadmap is less about “learning Python” and more about deciding where Python sits. If the team already has analysts comfortable with SQL and dashboards, Python can be introduced as the transformation and modeling layer. If the team is new to analytics, the guide for aspiring BAs is a useful companion for building the baseline skills that make Python BI workable.
What to standardize early
Standardize notebook naming, environment setup, and output ownership before the number of users grows. Decide which analyses are exploratory and which are production-grade. Document the line between those two, because that's where teams often get stuck.
A good test is whether a new hire can rerun an analysis without asking the original author three separate questions. If the answer is no, the workflow needs more structure.
When to keep the stack hybrid
Python does not need to replace traditional BI tools to be valuable. A common and sensible pattern is Python for data prep, modeling, and complex QA, then a dashboard layer for distribution. That gives technical teams control over logic while keeping consumption simple for business users.
If your organization wants that hybrid path without building everything from scratch, Querio is one option because it runs AI coding agents directly on warehouse data and supports Python notebooks alongside SQL and natural language. It's a practical fit when the goal is to keep self-serve analytics flexible without making data teams the manual bottleneck.
If you're deciding where Python belongs in your BI stack, Querio can help you keep the analysis close to the warehouse while preserving reproducibility and self-service. Visit Querio to see how warehouse-native Python notebooks and AI-assisted analytics can fit into a modern BI workflow.

