Customer Analytics: A Practical Guide
Master customer analytics with core metrics, segmentation methods, and warehouse-first workflows. Learn how product and growth teams turn data into decisions.
https://www.youtube.com/watch?v=HwiBD8MB-14
published
Outrank AI
customer analytics, data warehouse, cohort analysis, product analytics, growth metrics
c0528667-c34a-4e3c-95b3-a5c2d5646633

The most popular advice about customer analytics is incomplete: build better dashboards and teams will make better decisions. In practice, dashboards often become an elaborate waiting room. Product managers check them, marketers export screenshots, executives ask for another cut of the same metric, and no one changes the onboarding flow, campaign logic, or service process.
Customer analytics works when it operates as a decision system. It connects behavioral, transactional, and feedback data to a defined action, an accountable owner, and a way to measure whether the action changed customer behavior. That distinction matters because the market has matured far beyond periodic marketing reports. One estimate places the customer analytics market at USD 10.5 billion in 2020, with a projection of USD 24.2 billion by 2025, while another estimates USD 14.57 billion in 2023 and forecasts USD 48.63 billion by 2030. These estimates differ, but both describe a category that has become a major enterprise priority as digital channels multiplied available customer data (Mordor Intelligence).
Table of Contents
Why Most Customer Analytics Programs Fail to Drive Action
A dashboard answers, “What happened?” A useful analytics program also answers, “Who is affected, why might it be happening, what should we do next, and how will we know whether the intervention worked?”
Many teams stop after the first question. They instrument events, centralize data, select a BI platform, and publish reports. The organization then confuses visibility with execution. More charts can make a problem easier to see without making anyone responsible for solving it.
Customer analytics is a decision system
The execution gap is visible in recent industry research. A 2026 study found that many brands still run fewer than half of their analyses at the customer level, and only about one in five always use segmentation or testing to decide rollout actions (Mastercard). The problem isn't a lack of analytical sophistication. It's the distance between an insight and the workflow that should consume it.
A retention chart might reveal that new users disappear after setup. Action requires a product owner to define the friction, an analyst to identify the affected cohort, an engineer or designer to change the experience, and a team to evaluate the result. If the chart has no connection to that chain, it remains reporting.
Practical rule: Every customer metric should have a named decision owner and a documented action threshold.
Customer analytics evolved alongside relational databases, web analytics, social platforms, cloud infrastructure, and big-data systems. Early implementations were commonly controlled by marketing teams using tools such as SAS and SPSS. Web analytics later added page hits, session time, and cookie-based visitor tracking, while social platforms expanded the observable customer journey beyond a company's own site (Data Science Central).
Why more dashboards don't solve the problem
Modern platforms make self-serve exploration possible, but self-serve access alone doesn't guarantee good decisions. Teams still need shared definitions for customers, orders, active usage, churn, and attribution. They also need a workflow that turns an analysis into a tested product change, lifecycle campaign, or service intervention.
Founders should treat analytics change management as an operating problem, not a visualization project. The analytics change management playbook for founders is useful context because adoption depends on incentives, ownership, and repeatable habits as much as it depends on technology.
The practical test is simple: can a product or growth team move from a customer question to a trustworthy segment and an executable action without creating a new manual reporting queue? If not, the organization has a reporting stack, not yet a decision system.
Core Metrics and Segmentation Methods That Actually Matter
The metric that matters is the one that changes a decision. Retention, lifetime value, repeat purchase frequency, and engagement depth can all be valuable, but each becomes misleading when teams view it only as an aggregate.
A single retention rate can combine customers acquired through different channels, in different periods, with different product expectations. One acquisition cohort may be improving after an onboarding change while another is declining because a campaign brought in poorly matched customers. The combined figure can look stable while both underlying situations require action.
Build retention around cohorts
Retention analytics should pair acquisition cohort, time since first purchase or activation, and repeat-purchase frequency. That structure lets teams distinguish structural churn from a fixable lifecycle problem. The cohort analysis guide provides a practical foundation for organizing this view.
Benchmarks must also reflect the business model. A 90-day retention rate around 20% may be normal for consumer electronics, while subscription food and beverage has a 72% median and an 85% top-quartile benchmark over the same period (Metricono).
Category | Median 90-Day Retention | Top-Quartile Benchmark |
|---|---|---|
Consumer electronics | 20% | Not provided |
Subscription food and beverage | 72% | 85% |
The table isn't a scorecard for every company. It's a warning against applying one universal target to every customer journey. A product manager should compare a cohort with comparable purchase timing and category behavior, then ask whether the intervention changed the curve.
Choose metrics that lead to action
Retention rate tells you whether customers return within a defined period. It becomes useful when segmented by acquisition source, plan, geography, activation behavior, and first product used.
Customer lifetime value helps compare acquisition channels beyond the first transaction. A channel that produces immediate purchases may still underperform if those customers rarely return or require expensive service.
Repeat-purchase frequency is particularly useful for commerce and usage-based products. It supports campaign timing, replenishment logic, and customer prioritization.
Engagement depth should measure meaningful behavior, not activity for its own sake. A product team may care about completed workflows, successful exports, collaboration events, or repeated use of a core feature rather than raw sessions.
Lifecycle campaigns are most effective when they respond to these behavioral distinctions instead of sending identical messages to every customer. Teams looking for practical campaign patterns can use this resource on boosting engagement with lifecycle campaigns as a complement to cohort-based analysis.
Use relative benchmarks carefully
Google Analytics 4 benchmarking uses median, 25th percentile, and 75th percentile peer comparisons across normalized metrics such as percentages and ratios. Those benchmarks appear across acquisition, engagement, monetization, and retention reports (Quantum Metric).
Percentile comparisons help when raw volume differs across companies, regions, or traffic mixes. They don't explain the cause of a decline, but they can signal that a metric deserves investigation. A below-median retention result with stable volume points the team toward journey quality, cohort mix, or product friction rather than automatically toward demand generation.
Analysis Techniques for Product and Growth Decisions
Good customer analytics starts with a decision, not a model. Before writing SQL or selecting a machine-learning method, define the operational question: should we change onboarding, prioritize an account for outreach, adjust campaign eligibility, or shift acquisition investment?
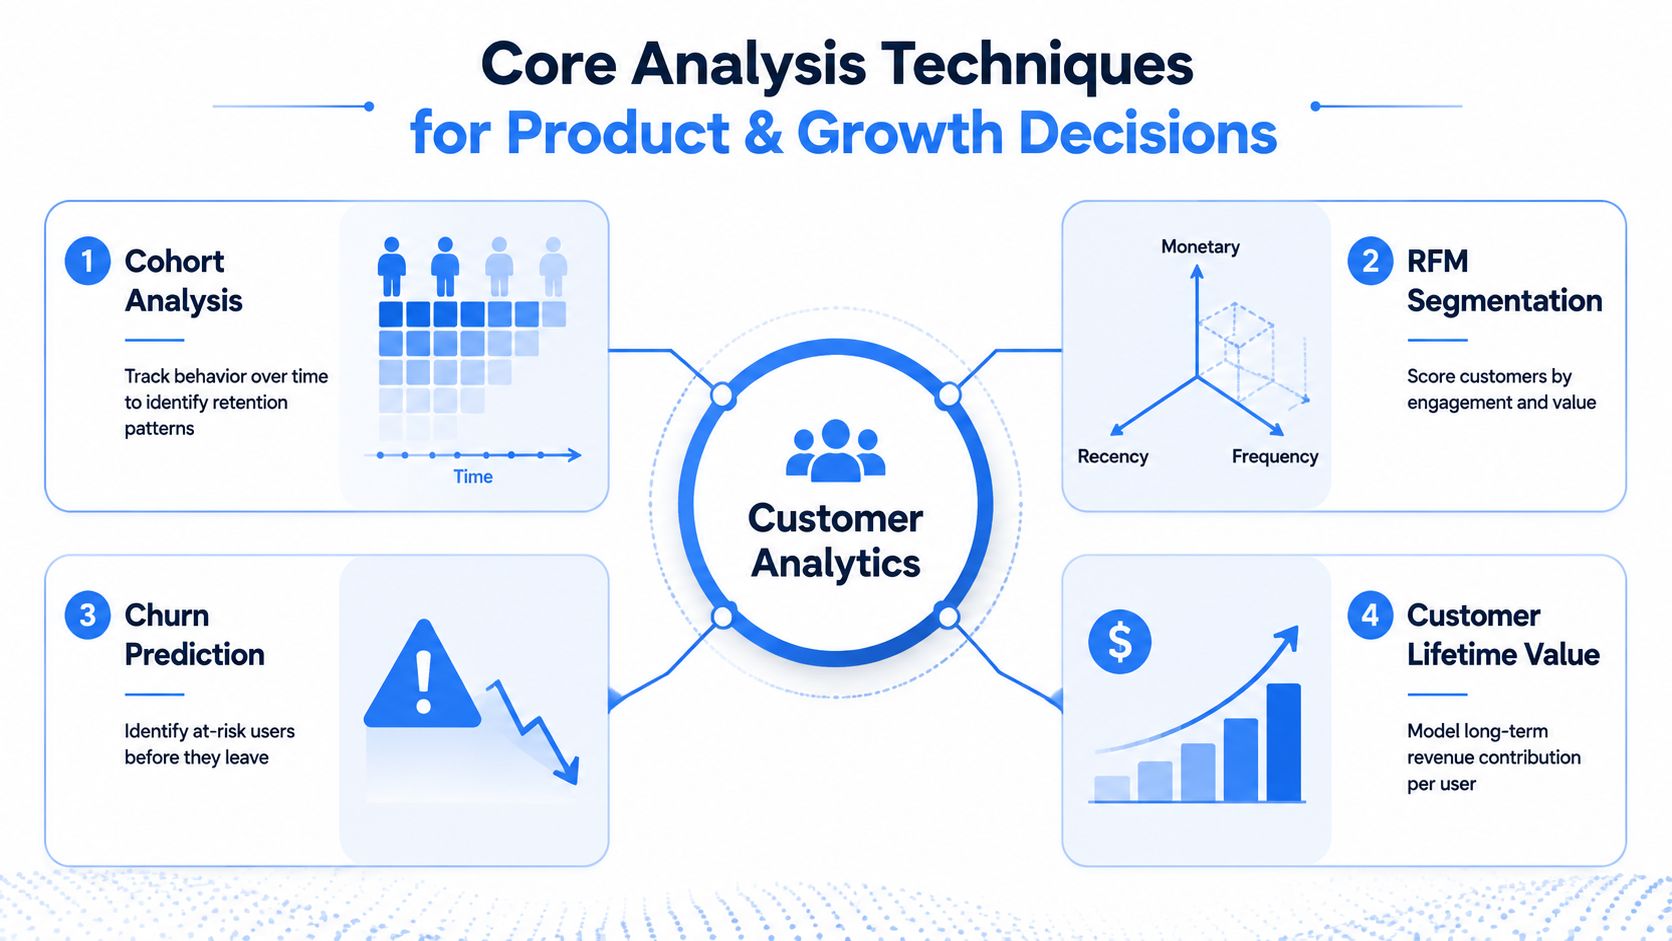
Cohort analysis
Cohort analysis groups customers by a shared starting point, such as signup month, first order, or first successful activation. The analyst then measures behavior at consistent intervals after that start.
A useful specification includes:
Cohort definition: Choose the event that represents the beginning of the relationship.
Outcome: Select retention, repeat purchase, activation, or feature adoption.
Comparison: Separate cohorts exposed to different product releases, campaigns, or onboarding paths.
Action: Assign a team to investigate meaningful divergence and test a response.
Cohorts reveal whether a change improves customer behavior over time. They don't prove causality by themselves, so controlled testing or careful comparison remains important.
RFM segmentation
RFM scores customers by recency, frequency, and monetary value. Recency identifies customers who have gone quiet, frequency separates occasional buyers from habitual users, and monetary value helps distinguish economic importance.
The output should be a treatment plan, not merely a label. A recently active, frequent, high-value customer may receive advocacy or expansion messaging. A high-value customer with declining recency may need service outreach. A low-frequency customer may need education rather than a discount.
Churn prediction
Churn prediction estimates which customers show signals associated with leaving. The feature set might include declining usage, failed payments, unresolved support interactions, reduced order frequency, or a missed milestone.
The production question is not whether the model can rank risk. It's whether a team can act on the ranking. Define the intervention, delivery channel, suppression rules, and measurement window before deployment. A model that produces a daily file no one uses is an expensive report.
Customer lifetime value modeling
CLV modeling estimates long-term revenue contribution by customer or acquisition source. A practical model should make assumptions visible, including expected purchase behavior, margin treatment, observed history, and uncertainty.
Growth teams can use CLV to compare channels, but they shouldn't replace observed performance with optimistic forecasts. Start with a transparent baseline, validate it against later customer behavior, and update the model as cohorts mature.
For product leaders, the data analytics guide for product managers offers useful framing for connecting these methods to roadmap and growth decisions.
The following video provides another visual introduction to the techniques and their role in customer analytics:
Data Architecture and the Warehouse-First Foundation
Customer analytics fails in production when the architecture preserves sources instead of relationships. A web event stream, billing system, CRM, support platform, and marketing tool can each be accurate in isolation while still producing contradictory customer views.
A warehouse-first design gives teams a durable place to reconcile those sources. The warehouse isn't valuable because it creates attractive charts. It's valuable because it can hold consistent entities, historical records, transformations, and access rules that downstream users can reuse.

Instrumentation comes before interpretation
A reliable foundation starts with event definitions and ownership. Teams should document what counts as activation, purchase, cancellation, support resolution, and meaningful engagement. They should also record when definitions change, because historical comparisons become unreliable when the same event name represents different behavior over time.
ETL or ELT pipelines then bring source data into the warehouse, where transformations create reusable customer, order, subscription, product, and interaction models. Analysts should be able to trace a dashboard metric back to its source and understand its freshness, exclusions, and known limitations.
The historical move toward cloud and big-data infrastructure made continuous, cross-channel analysis more practical than sample-based reporting. But infrastructure alone doesn't create a unified view. Governance determines whether teams agree on identity resolution, consent, retention, and access.
Real-time access isn't the same as data maturity
Recent CX research found that 54% of enterprises cannot access and use real-time data, 60% report dark data, and only 30% share customer engagement data within a CX or CRM platform (SAP). These findings describe an integration problem, not merely a dashboard problem.
A mature stack can still leave customer-facing teams waiting if data remains trapped in source applications. A unified customer view requires shared identifiers, dependable ingestion, modeled relationships, and clear policies for which system owns each attribute. Organizations evaluating integration patterns may find this discussion of a customer data platform with Mulesoft relevant to the broader architecture decision.
The enterprise data warehouse definition also helps clarify the warehouse's role. The target isn't a warehouse that only serves data specialists. It's a governed foundation that lets product, marketing, and service teams explore trusted data without forcing analysts to answer every recurring question manually.
Implementation Workflows and Sample Queries for Teams
A practical customer analytics workflow begins with the decision and works backward to the data. The SQL below uses generic warehouse syntax, so teams should adapt date functions and table names to their platform.
Retention cohort query
Ask: Do customers acquired in a given period return at the expected point in their lifecycle?
The query produces a retention matrix. The action might be to compare cohorts before and after an onboarding change, then inspect the journey of customers whose return behavior diverges.

RFM segmentation
Ask: Which customers need different outreach?
Score each field within a defined comparison population, then create segments such as loyal, new, reactivation, and high-value at risk. Store the segment assignment with a timestamp so marketing can reproduce the audience and analysts can evaluate outcomes.
Churn signals
Ask: Which accounts show declining behavior before cancellation?
Create a feature table with recent usage, change in usage, billing status, support activity, and time since a meaningful product action. Start with interpretable rules or a transparent model. The intervention should be tied to a specific owner, such as customer success for account outreach or product for an activation fix.
CLV by acquisition channel
Ask: Which channels attract customers who create durable value?
Join acquisition source to customer-level order history, then calculate observed revenue and margin over comparable customer ages. A notebook can test assumptions, plot cohort curves, and compare model outputs with actual outcomes. Non-technical users should receive a governed interface or saved analysis, while analysts maintain definitions and quality checks.
That division changes the data team's role. Instead of acting as a human API for every segmentation request, analysts maintain reusable models, notebooks, permissions, and documentation that let teams answer related questions independently.
Common Pitfalls and How to Measure What Matters
The most damaging failure isn't a bad chart. It's a customer analytics program that creates confidence without changing behavior.
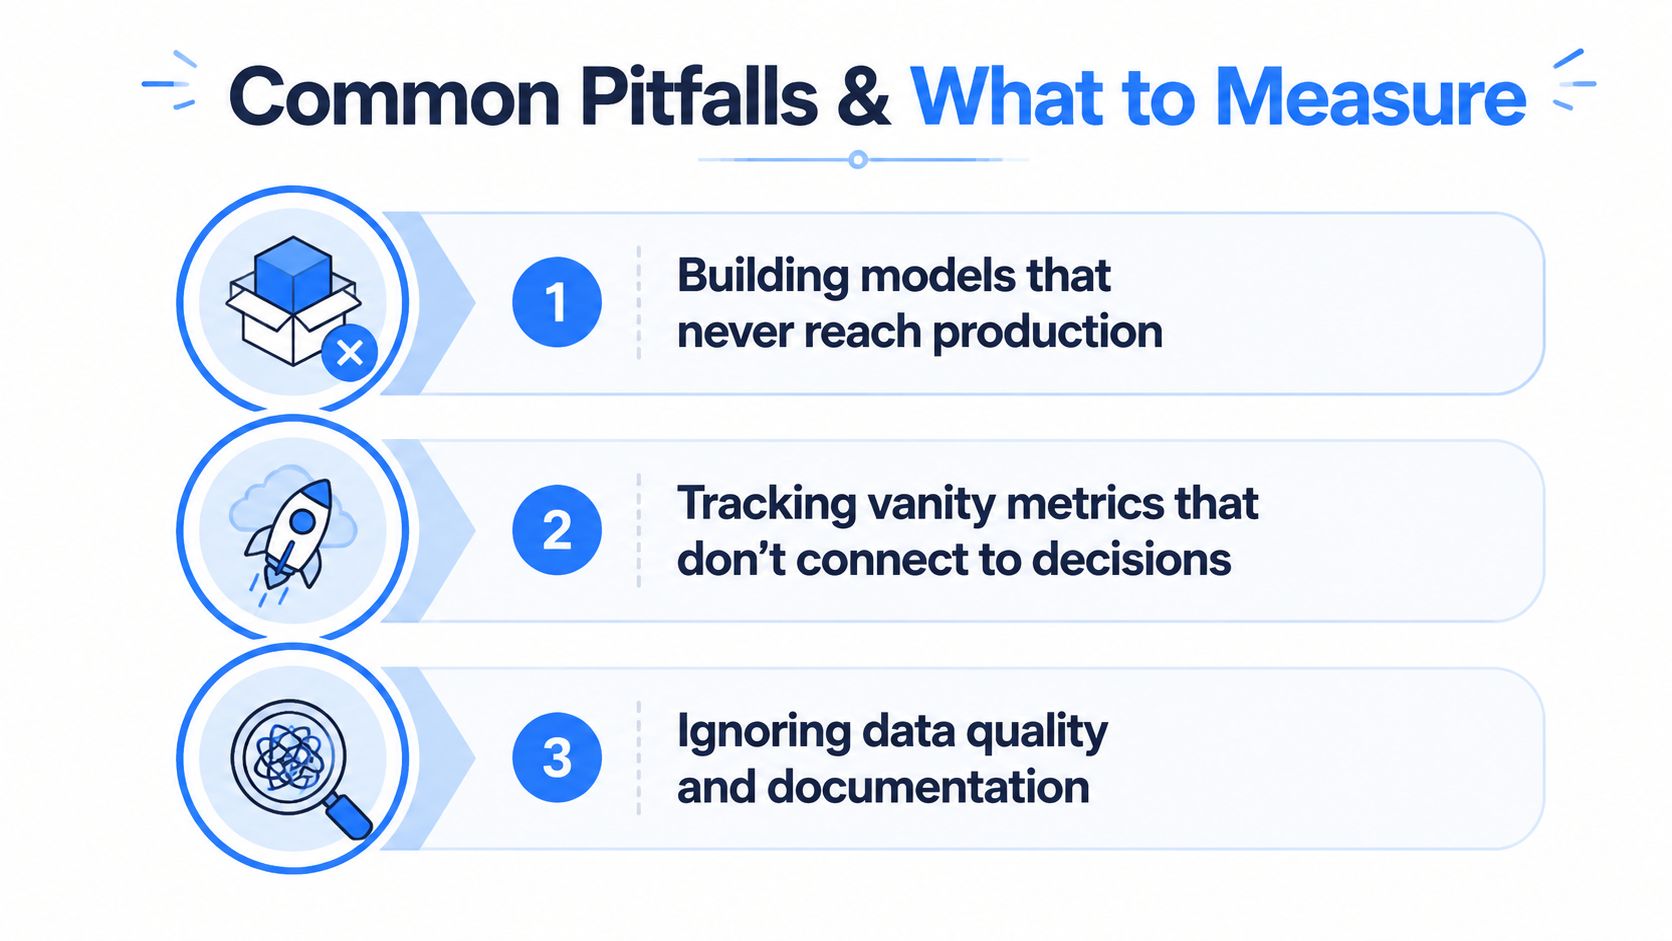
Warning signs in production
Models never reach production: If a churn score exists only in a notebook, it isn't part of the operating system. Define a delivery path, intervention owner, and monitoring plan before expanding model complexity.
Vanity metrics dominate reviews: Page views, raw sessions, and total events may describe activity without showing customer value. Replace them with metrics connected to activation, retention, completed outcomes, or service resolution.
Aggregate metrics hide cohort damage: A stable overall rate can conceal an improving cohort and a deteriorating one. Require cohort and segment views for decisions involving lifecycle behavior.
Data quality remains undocumented: If teams can't explain freshness, identity matching, exclusions, or event changes, they shouldn't treat the metric as authoritative.
Measure the analytics program itself
Customer outcomes remain important, but data leaders also need operational measures:
Analysis-to-action time: Track how long it takes to move from a question to a decision and an assigned intervention.
Segmentation-informed decisions: Record how often product, marketing, and service decisions use a defined customer segment or cohort.
Self-serve query adoption: Monitor whether teams can answer recurring questions through governed models and notebooks rather than manual analyst requests.
Experiment follow-through: Count whether recommended changes receive a documented test, rollout decision, and post-launch review.
These measures expose the difference between producing insight and using it. A team can have excellent data quality and still underperform if no operating rhythm connects analysis to action.
Accelerating Self-Serve Analytics with Querio
Traditional BI tools such as Looker, Hex, and ThoughtSpot are useful in different operating models, but they often center the workflow on reports, semantic layers, or predefined exploration surfaces. That can work for standardized executive reporting. It becomes restrictive when a product manager needs to investigate an unfamiliar customer pattern, combine warehouse tables, and turn the result into a reusable analysis.
A warehouse-first tool takes a different route. Querio deploys AI coding agents directly on the data warehouse and uses a file system approach with custom Python notebooks, allowing technical and non-technical users to query, analyze, and build on company data without waiting for an analyst. Data teams maintain the infrastructure, models, permissions, and quality controls instead of manually answering every repeated question.
Compare the operating models
A conventional BI workflow often looks like this:
An executive asks for a new customer cut.
An analyst interprets the request and writes a query.
The result becomes a dashboard or one-off export.
A follow-up question creates another queue item.
A warehouse-first notebook workflow can preserve the analysis as a reusable file. The product manager can adjust a cohort definition, test a segment, or inspect a support signal within approved access boundaries. The data team can review the logic, improve the underlying model, and promote useful work into a maintained asset.
That flexibility still needs governance. Query access, customer identity rules, metric definitions, and production review should remain controlled. Self-serve analytics doesn't mean ungoverned access. It means the organization places governance in the infrastructure so exploration doesn't depend on a person manually mediating every request.
The approach is particularly relevant when customer analytics must move into operational or customer-facing experiences. A warehouse-backed analysis can support internal investigation first, then become a maintained workflow or embedded experience when the use case is stable.
Querio fits this model by helping teams work directly with warehouse data through AI-assisted coding agents and custom Python notebooks. The evaluation question is practical: can your teams answer customer questions faster while preserving traceability, access controls, and production ownership?
Querio gives product, growth, and data teams a warehouse-first way to query customer data, build reusable analyses, and reduce dependence on manual reporting queues. Visit Querio to evaluate how its AI coding agents and custom Python notebook workflow could turn your customer analytics program into a system that changes decisions.


