10 Key Customer Experience Statistics for 2026
Discover 10 crucial customer experience statistics for 2026. See what the latest CX data means for your business and how to act on it with self-serve analytics.
published
Outrank AI
customer experience statistics, cx stats, customer analytics, data driven cx, business intelligence
9cc7d6b4-bf5f-4360-8237-23830b6bbf71

73% of consumers say customer experience is a key factor in purchasing decisions, and that puts CX just behind price and product in importance, according to the baseline research on customer experience statistics. That single data point changes how leaders should think about growth. CX is no longer a support function that sits downstream of revenue, it's part of the revenue mechanism itself.
The problem isn't awareness, it's execution. Product managers see friction in the funnel, data teams see ticket volume or journey drop-off, and executives see churn or slower growth, but those signals often live in separate tools and separate meetings. By the time an analyst has stitched the story together, the customer has already left or the opportunity has passed.
That's why customer experience statistics matter most when they're tied to an operating model. The point isn't to collect more numbers for a slide deck. The point is to build a self-serve analytics workflow that helps data, product, and support teams find the root cause faster, segment the impact clearly, and act before the damage spreads.
Table of Contents
1. 86% of Customers Will Pay More for Better Customer Experience
4. 80% of Companies Compete Primarily on Customer Experience
5. Only 35% of Employees Have Real-Time Access to Business Data They Need
6. 64% of Customers Expect Personalized Interactions Based on Their Past Behavior
7. 70% of Companies Say Data Silos Negatively Impact Customer Experience
8. Companies Using Predictive Analytics Achieve 5-10x ROI on Analytics Investments
9. 82% of Consumers Want Companies to Understand Their Expectations Without Being Told Repeatedly
10. 43% of Data Analytics Projects Fail to Deliver Business Value
1. 86% of Customers Will Pay More for Better Customer Experience
A willingness to pay more is the clearest sign that CX has moved from a brand preference to a pricing lever. When customers are prepared to spend more for a better experience, product and data leaders can't treat service quality as a soft edge case. They have to measure it like they measure conversion, retention, and margin.
The strategic implication is simple. If the experience justifies the premium, then analytics should help prove where that premium comes from, whether it's onboarding speed, support quality, or product friction reduction. Teams that connect experience metrics to revenue per customer can see which journeys support pricing power and which ones erode it.
What product and data teams should measure
Self-serve analytics works best when it turns a broad sentiment into a specific operating signal. Querio's customer experience dashboard approach is useful here because teams can centralize feedback, support, and usage metrics without turning every question into an analyst ticket. See the structure in Querio's customer experience dashboard.
Practical rule: If the CX metric doesn't connect to a commercial outcome, it's not yet a decision metric.
Useful examples include premium software tiers, subscription services that personalize recommendations, and luxury brands that treat service as part of the product. Apple's ecosystem, Netflix's recommendation experience, and high-touch B2B services all show the same pattern, customers pay for reduced friction and greater relevance. The analytical task is to isolate where that premium is earned, then replicate it in other journeys.
A strong operating model usually includes three layers. First, product managers need a dashboard they can open without waiting on an analyst. Second, data teams need reusable Python notebooks for segmenting customers by experience quality and lifetime value. Third, support and operations need alerting so they can spot friction before it turns into lost revenue.
Track experience by segment: Compare high-value accounts, first-time buyers, and repeat customers separately, because the same issue won't affect each group equally.
Monitor friction in real time: Watch changes in NPS, CSAT, and support themes together so you can connect sentiment to behavior.
Build one shared definition: Align business and product teams on what “good experience” means before they start measuring it differently.
2. 73% of Customers Expect Unified Omnichannel Experiences
Customers do not evaluate service by channel. They start on mobile, move to email, switch to chat, and may finish in a store or through support. That creates a data problem before it becomes a service problem, because the journey only makes sense when teams can connect those touchpoints into one record.
Most companies still split the evidence. Web events live in one system, in-store behavior lives in another, and support history sits somewhere else. A self-serve platform helps because product managers can ask cross-channel questions without waiting for engineering to normalize every event by hand.
The business implication goes beyond convenience. Omnichannel consistency shapes whether a customer feels remembered or forced to start over. When teams can query a unified customer view, they can see where context breaks, such as from mobile checkout to post-purchase support, or from app usage to account management.
The test is not whether each channel works on its own. The test is whether the customer has to repeat themselves when they move between them.
Real-world brands have trained customers to expect that continuity. Amazon links browsing across devices, Sephora blends loyalty across physical and digital touchpoints, and Starbucks connects the app to purchases and rewards. The point is not just better UX, it is a data integration strategy expressed through customer experience. That same logic is now showing up in agentic shopping journeys, including the AI agent for ecommerce model that tries to preserve context while moving a buyer from discovery to checkout.
A useful analytics setup should let teams answer which channel creates the most drop-off, whether support issues rise after in-store purchases, and where customers lose context in the handoff. That requires a unified model, not a patchwork of screenshots and exported spreadsheets. Querio is relevant here because it can consolidate data from multiple sources without forcing every team through a heavy ETL workflow.

Build a unified customer profile: Merge web, app, support, and transaction data into one analytical layer.
Separate channel performance from journey performance: A strong channel can still fail the handoff.
Give product teams direct access: If they can query omnichannel behavior themselves, they can test ideas faster.
3. 49% of Customers Will Leave After a Bad Experience
Bad experiences are not just unpleasant, they're structurally expensive. When nearly half of customers leave after a negative event, retention stops being a downstream metric and becomes an early-warning system. Every checkout error, broken workflow, or unresolved support interaction needs to be treated as a churn risk.
The fastest teams don't wait for quarterly reviews to find the leak. They track operational signals like load time, error rates, and support resolution speed as leading indicators of customer loss. That matters because the customer doesn't care whether the issue came from engineering, operations, or support, they just experience a failed journey.
How to catch damage before it spreads
A good CX analytics stack should make friction visible the moment it appears. That means rapid-response dashboards for support queues, checkout drop-offs, app crashes, and escalation patterns. It also means letting product managers explore churn drivers directly instead of waiting for an analyst to run each query.
The analysis should focus on where the failure occurred, not just whether a customer is unhappy. A social post about slow support, a cart that won't load, or a crash inside a key workflow each points to a different fix. If teams roll all of that into one satisfaction score, they lose the ability to intervene precisely.
Use Querio's churn reduction workflow to connect behavior signals with retention analysis, especially when customer feedback, ticket sentiment, and usage patterns live in different systems.

A useful operating habit is to review experience degradation week over week, not just after a visible incident. That gives teams time to see whether a small rise in failures is becoming a trend. It also helps non-technical users participate in the analysis, which matters when support, product, and data need to align on the same root cause.
Operational insight: The faster a team can see customer friction, the less likely it is to turn into public churn.
4. 80% of Companies Compete Primarily on Customer Experience
When most companies say they compete on CX, the strategic bar changes. Price and product still matter, but they're no longer enough on their own. The companies that win are the ones that can measure experience quality faster, segment it more accurately, and turn the findings into action before competitors do.
That's why analytics becomes a strategic capability instead of a reporting function. DoorDash competes on delivery reliability, Tesla competes on software and interface experience as much as vehicle quality, and Loom competes on simplicity and customer education. In each case, the product experience is the market position.
For data teams, the conclusion is blunt. If CX is the battlefield, then analytical agility is part of the weaponry. Product leaders need dashboards they can trust, and they need them fast enough to make decisions while the issue is still current. If they're waiting days for a query, they're already behind the customer.
Why democratized analytics changes the game
Self-serve access matters because CX problems rarely live in a single report. A support ticket spike might be caused by a release change, a funnel step might be confusing only for one segment, or an onboarding issue might hit mobile users harder than desktop users. A good platform lets business teams explore those patterns directly instead of filing requests and waiting.
This is also where standardization helps. Teams should agree on a core CX metric framework, then build dashboards that each function can use without reinterpreting the data from scratch. Querio's file-system approach and custom Python notebooks are relevant because they let teams iterate on those definitions without rebuilding their analytics layer every time.
The most effective organizations treat CX analysis as a shared operating rhythm. Product reviews, support operations, and leadership meetings all draw from the same metrics, but each team asks different questions. That separation is healthy. It means the data layer serves the business, not the other way around.
5. Only 35% of Employees Have Real-Time Access to Business Data They Need
This statistic explains a lot of CX failure. If most employees can't access the data they need in real time, then customer decisions slow down at the exact moment speed matters most. The issue isn't only data quality, it's data availability.
The bottleneck shows up everywhere. Product managers wait on cohort analysis, marketers wait on segmentation, and finance teams wait on reports instead of exploring the data themselves. That delay adds friction to customer-facing decisions, because the people closest to the problem can't validate hypotheses quickly.
The fix is usually operational, not philosophical. Teams need direct access to warehouse data with guardrails, reusable notebook templates, and simple interfaces that don't require SQL expertise. That doesn't eliminate the data team, it changes its role from report factory to infrastructure owner.
Practical rule: If a recurring CX question takes days to answer, the analytics workflow is the problem.
A self-serve setup should start with high-frequency questions. Product metrics, funnel analysis, and segment exploration are the obvious first use cases because they come up repeatedly and affect customer decisions every week. Once those are accessible, teams can move to more specialized CX analysis without creating more analyst bottlenecks.
The ROI comes from time saved and decisions made faster. Teams don't need a perfect platform on day one, they need one that removes the waiting. Querio is built for that kind of workflow because it lets non-technical users query company data without depending on analysts for every question.
6. 64% of Customers Expect Personalized Interactions Based on Their Past Behavior
Personalization is no longer a differentiator in many markets, it's an expectation. When customers expect brands to recognize their behavior, generic messaging starts to look careless. That has direct consequences for product design, lifecycle marketing, and support.
The analytics burden behind personalization is heavy. Teams have to understand behavior patterns, create useful customer cohorts, and update those cohorts as new data arrives. That is hard enough for a mature data team, and it becomes much harder when product and marketing teams need to test ideas independently.
Personalization only works if teams can measure it
Netflix, Amazon, Spotify, and apparel retailers all show the same operating logic. They use behavior to shape recommendations, content, and offers, then they measure whether those experiences change engagement or purchase behavior. If the measurement layer is weak, personalization becomes guesswork with a nicer label.
Querio's sentiment analysis workflow for reviews is useful here because customer feedback often explains whether personalization feels helpful or creepy. See the approach in Querio's sentiment analysis on reviews. That matters when product and marketing teams are deciding whether a recommendation engine is improving the experience.
A practical self-serve setup should include cohort analysis notebooks, reusable RFM segments, and A/B testing workflows that product and growth teams can use without analyst dependency. It should also feed insights back into the product loop so teams can see whether recommendations, onboarding paths, or next-best-action logic are improving outcomes.
Analyze behavior by cohort: Look at purchase history, browsing behavior, and support context together.
Keep the feedback loop visible: Teams need to see whether personalization changes outcomes.
Respect privacy and governance: The more personalized the experience, the more important clean data handling becomes.
Double My Leads scale guide is a useful reference point for teams thinking about personalization as a system rather than a campaign.
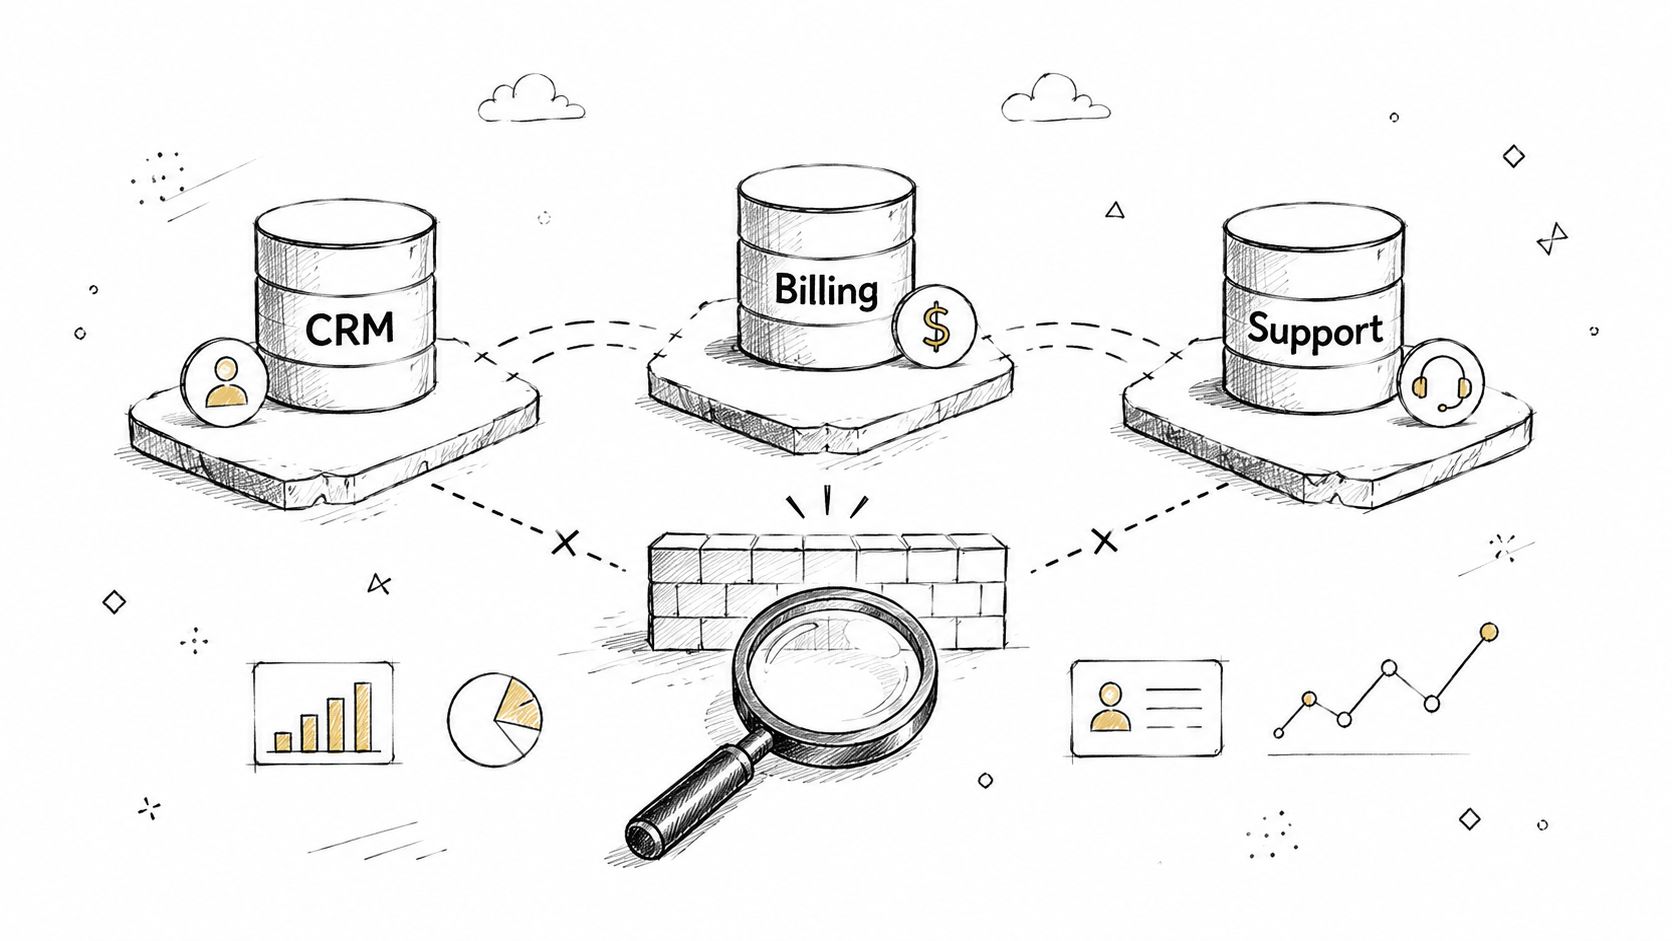
7. 70% of Companies Say Data Silos Negatively Impact Customer Experience
Data silos are one of the least glamorous but most damaging CX problems. They make it impossible to see the full customer journey, and they force teams to make decisions with partial context. A customer who switches from web to support to billing shouldn't become a different record at each step, but in many companies that's exactly what happens.
The effect is visible in the handoffs. E-commerce teams can't always connect browsing to in-store purchases, SaaS companies lose context across support and billing systems, and insurers struggle to connect claims with policy inquiries. Those gaps create inconsistent service and slow resolution, both of which weaken trust.
The analytical fix starts with a unified warehouse and standard customer dimension tables. From there, self-serve access matters because the people who need the context, product managers, support leads, and operations managers, can explore it directly. If they have to wait for someone to stitch together three systems, the insight arrives too late to help the customer.
The real cost of silos is not missing data. It's missed context.
A mature CX analytics stack should make data quality visible, not hidden in a back room. Teams should see where records break, where IDs don't match, and where support systems fail to connect to transaction data. That visibility creates accountability and makes it easier to prioritize the highest-impact integrations first.
This is also where standardization pays off. If the same customer definition is used across product, finance, and support, then every team can ask better questions with less friction. Querio supports that kind of unified workflow because it lets teams query shared data directly instead of relying on a patchwork of exports.
8. Companies Using Predictive Analytics Achieve 5-10x ROI on Analytics Investments
Descriptive reporting tells you what happened. Predictive analytics tells you where the risk and opportunity are likely to appear next. That shift matters because CX work is often about prevention, stopping churn, reducing friction, and prioritizing the next best action before the customer experience breaks down.
The return comes from better decisions, not just fancier models. Churn prediction can trigger retention outreach, CLV prediction can shape acquisition strategy, and demand forecasting can support operations planning. In each case, analytics becomes a lever that changes action, not just a dashboard that explains history.
Predictive work needs broader access
Many teams don't fail because they lack data science talent. They fail because predictive workflows are too slow, too technical, or too isolated from the business. When product teams can't test a prediction or use a score in their day-to-day work, the model stays stuck in a notebook.
Self-serve analytics changes that. Querio's AI agents can help automate parts of the workflow, while modular Python notebooks let teams adapt common prediction use cases without building everything from scratch. That gives product and data teams a practical bridge between model development and business execution.
Start with high-value use cases that are easy to explain and easy to act on. Churn, customer lifetime value, and conversion probability are usually the best entry points because they connect directly to revenue decisions. Once those are working, teams can move into more complex scoring and prescriptive workflows.
The key is monitoring. Predictive models drift as customer behavior changes, so teams need a process for retraining, review, and performance checks. If the score stops reflecting reality, the business stops trusting it.
Practical rule: A predictive model only matters if the business can use it before the customer's next decision.
9. 82% of Consumers Want Companies to Understand Their Expectations Without Being Told Repeatedly
82% of consumers want brands to understand what they need without forcing them to explain it again and again. That expectation changes the problem from basic service consistency to context management across the full customer journey. If a company cannot preserve preferences, history, and prior intent, every new interaction starts with avoidable friction.
The analytical burden is larger than many teams plan for. Product and data leaders need customer profiles that unify behavior across touchpoints, governance that keeps those profiles current, and feedback loops that show whether the memory layer is improving the experience. If the system remembers the wrong details, it creates frustration instead of convenience.
That means the work cannot stop at personalization banners. Context has to shape recommendations, onboarding, support routing, and proactive outreach. A customer who already explained a problem in one channel should not be asked to repeat it in another.
Querio's customer insights platforms help teams turn behavioral patterns into reusable attributes that can support that kind of memory. The value is practical, because it lets analysts and product teams work from the same behavioral context instead of sending every question into a separate data queue. That shortens the path from insight to action and makes remembered context usable in daily operations.
A strong implementation combines customer profiles, behavioral scoring, and clear privacy controls. The goal is strategic context use, with the right information available at the right moment. Customers notice the difference quickly when a brand remembers them accurately and uses that memory in a way that improves the interaction.
10. 43% of Data Analytics Projects Fail to Deliver Business Value
This is the most important warning in the set. Analytics can fail even when the tooling looks advanced and the dashboards look polished. If the work doesn't align to a real business decision, it won't create value.
The common reasons are familiar, analyst bottlenecks, poor business alignment, weak adoption, and tools that are too complex for non-technical users. That means the failure is often organizational, not technical. Teams launch the project, but nobody changes how decisions get made.
Build for adoption, not just deployment
The easiest way to improve analytics success is to start with a business outcome and work backward. Product managers, marketers, and support leaders should help define the use case before the tool is selected. If they don't own the problem, they usually won't own the adoption.
Self-serve analytics platforms help because they reduce friction between a question and an answer. Querio's AI coding agents and notebook-based workflow are relevant here because they let both technical and non-technical users work off the same data warehouse without waiting for separate reporting cycles. That makes it easier to track time-to-insight and decisions influenced, which are better measures of success than project count.
A useful governance model includes training, shared metrics, and feedback loops. If a dashboard sits unread in an inbox, that's not a data problem, it's a workflow problem. Fix the workflow and the project has a much better chance of showing business value.
The most effective teams treat analytics as an internal product. They design for usage, iterate based on feedback, and retire metrics that no one acts on. That discipline is what keeps CX analytics from becoming another expensive reporting layer.
Top 10 Customer Experience Statistics Comparison
Item (source, year) | Implementation complexity | Resource requirements | Expected outcomes | Ideal use cases | Key advantages |
|---|---|---|---|---|---|
86% will pay more for better CX (Forrester, 2023) | Medium, CX improvements + analytics workflows | Investment in self-serve analytics, dashboards, data access | Revenue uplift; stronger justification for CX spending | CX optimization; executive alignment and ROI cases | Clear business case for investment; aligns data work with revenue |
73% expect seamless omnichannel (McKinsey, 2023) | High, unify systems and real-time correlation | Unified data platform, real-time integration, engineering effort | Consistent cross-channel experiences; improved retention | Retail, ecommerce, multi-touch customer journeys | Competitive differentiation when executed; higher loyalty |
49% will leave after a bad experience (PwC, 2023) | Medium–High, rapid detection and response systems | Real-time monitoring, anomaly detection, alerting, on-call analytics | Reduced churn; faster incident remediation | Support, critical user flows, high-risk touchpoints | Urgency to act; motivates automation of routine insights |
80% compete primarily on CX (Gartner, 2023) | High, org-wide analytics at business tempo | Modern analytics infra, decentralization, training | Strategic differentiation; sustained competitive edge | Product-led firms, service differentiation strategies | Justifies analytics modernization; aligns analytics to strategy |
Only 35% have real-time access (Forrester, 2023) | Medium, tool rollout + culture change | Self-serve tools, templates, training, change management | Faster decisions; fewer analyst bottlenecks | Democratizing analytics across teams (PMs, marketing) | Large ROI opportunity from improved access and speed |
64% expect personalized interactions (Epsilon, 2023) | High, per-customer behavioral analytics | Behavioral data pipelines, modeling, privacy/compliance controls | Higher conversion and customer lifetime value | Personalization engines, targeted marketing, recommendations | Increases conversion and LTV; personalization as baseline |
70% say data silos harm CX (Forrester, 2023) | High, data integration and governance projects | Warehouse consolidation, ETL/ELT, data governance resources | Holistic customer view; better cross-team decisions | Cross-channel analytics, enterprise reporting, unified profiles | Strong ROI from unification; enables coordinated experiences |
Predictive analytics yields 5–10x ROI (McKinsey, 2022) | High, modeling, pipelines, ongoing maintenance | Data scientists, feature engineering, model ops and monitoring | Proactive decisions; significant ROI on analytics spend | Churn prediction, CLV, demand forecasting, fraud detection | Exceptional ROI; enables foresight and proactive action |
82% want companies to understand them without repeating (Accenture, 2023) | High, persistent customer memory and profiling | Cross-touchpoint profiles, real-time scoring, governance | Higher satisfaction, loyalty, cross-sell opportunities | Concierge services, proactive personalization, banking | Competitive advantage from contextual, predictive service |
43% of analytics projects fail (Gartner, 2022) | Variable, often high due to misalignment | Change management, user involvement, simpler self-serve tools | Higher project success if adoption and alignment improved | Analytics transformation, tool selection, adoption programs | Highlights need for user-centered design and adoption focus |
From Insight to Action Activating Your CX Data
The statistics point in the same direction. Customer experience is now tied to willingness to pay, retention risk, omnichannel expectations, personalization, and the ability to compete at all. But the hardest part of CX work isn't collecting the data. It's getting the right people access to it fast enough to do something useful.
That's where many companies get stuck. They have support data, product data, transaction data, and feedback data, but each team sees only part of the picture. By the time an analyst assembles the context, the customer journey has already moved on. In practice, that means the business is reacting to symptoms instead of managing the experience itself.
The better model is self-serve analytics with clear governance. Data teams should own the warehouse, the definitions, and the quality layer, while product and business teams should be able to query, segment, and test without filing every request through a queue. That shift turns CX from a quarterly discussion into a daily operating system.
Querio fits naturally into that model because it's built to let overwhelmed data teams support self-serve analysis on top of the warehouse. The value isn't just faster dashboards, it's faster decisions, fewer bottlenecks, and a tighter connection between customer signals and business action. For teams that want CX metrics to drive actual behavior, that difference matters.
If your team is trying to turn CX data into faster decisions, Querio gives product and data teams a self-serve way to query warehouse data, analyze experience metrics, and build reusable notebooks without waiting on analyst support. Visit the platform to see how it can help you measure customer friction, surface at-risk accounts, and operationalize customer experience statistics across the business.

