Build Your Data Infrastructure and Analytics Stack
Build a modern stack with our guide to data infrastructure and analytics. Learn core components, architectures, and mid-market migration strategies.
https://www.youtube.com/watch?v=WIfgkHYVDvw
published
Outrank AI
data infrastructure and analytics, self-service analytics, data stack, data migration, ai agents
23d1e868-6c35-40f6-8c98-c21368b898a9
The situation is usually obvious long before anyone says it out loud. The CEO asks a simple question about retention, margin by segment, or feature adoption. A product lead has one number from Mixpanel, finance has another from the warehouse, and the data team says it can reconcile the difference by next week. Meanwhile, the business keeps moving.
That's not a reporting problem. It's a data infrastructure and analytics problem.
When a company reaches this stage, the old model breaks. Analysts become a service desk. Every dashboard turns into a debate over definitions. The warehouse fills up, but trust doesn't. Leadership starts asking for self-service, yet the first version of self-service usually creates a new mess: duplicate metrics, copied SQL, orphaned notebooks, and teams making decisions from slightly different versions of the truth.
Analytics is no longer a side capability. The global data analytics market was valued at $69.54 billion in 2024 and is projected to reach $302.01 billion by 2030 according to recent industry reporting summarized by Edge Delta. That projection doesn't just describe software spend. It reflects a structural shift in how companies operate. Data now sits in the path of product, finance, sales, operations, and increasingly AI.
The question for a new CEO isn't whether to invest in analytics. It's whether your company will keep treating analytics as a queue of requests, or build it as a governed platform that people can use without breaking trust.
Table of Contents
From Data Overload to Decisive Action
A lot of executive teams think they have a talent problem when they have a systems problem.
The symptom shows up as delay. Revenue questions take days. Board prep turns into a sprint across Stripe, Salesforce, HubSpot, Snowflake, and a pile of spreadsheet exports. Product and finance both have competent people, but neither team can get to a shared answer without pulling an analyst into the middle. Over time, leadership starts to believe the company has “lots of data” but “not enough insight.”
That diagnosis is incomplete. Most companies don't suffer from lack of data. They suffer from data that arrives late, lands in the wrong shape, or gets modeled differently by each team.
The cost of waiting for answers
When analytics runs through a ticket queue, the business slows down in quiet ways. Product teams postpone experiments because they can't trust event definitions. Finance builds side calculations because the dashboard logic isn't transparent. Sales leaders export CSVs because the official report doesn't answer the operational question in front of them.
None of those workarounds look catastrophic on their own. Together, they create a company that acts slower than it should.
The first failure mode in analytics isn't bad charts. It's decision latency.
The turning point usually comes when leadership asks for self-service. That instinct is correct. But “give everyone dashboard access” rarely solves the underlying issue. If the warehouse contains inconsistent models and business logic lives in personal queries, self-service only spreads inconsistency faster.
What decisive action requires
A modern stack has to do more than store data. It has to make trusted data reusable. That means the core job of the data team changes. Instead of answering every question by hand, the team builds reliable pipelines, shared definitions, governed access, and workflows that let others move without creating chaos.
The companies that get this right stop treating analytics as a reporting function. They treat it as operating infrastructure.
Why Infrastructure Is the Foundation for Analytics
Data infrastructure determines whether analytics becomes an operating system for the business or a reporting queue that gets slower every quarter. A CEO feels that difference quickly. One setup produces trusted numbers, controlled access, and fast iteration. The other produces dashboard debates, analyst bottlenecks, and teams building their own versions of revenue in spreadsheets.
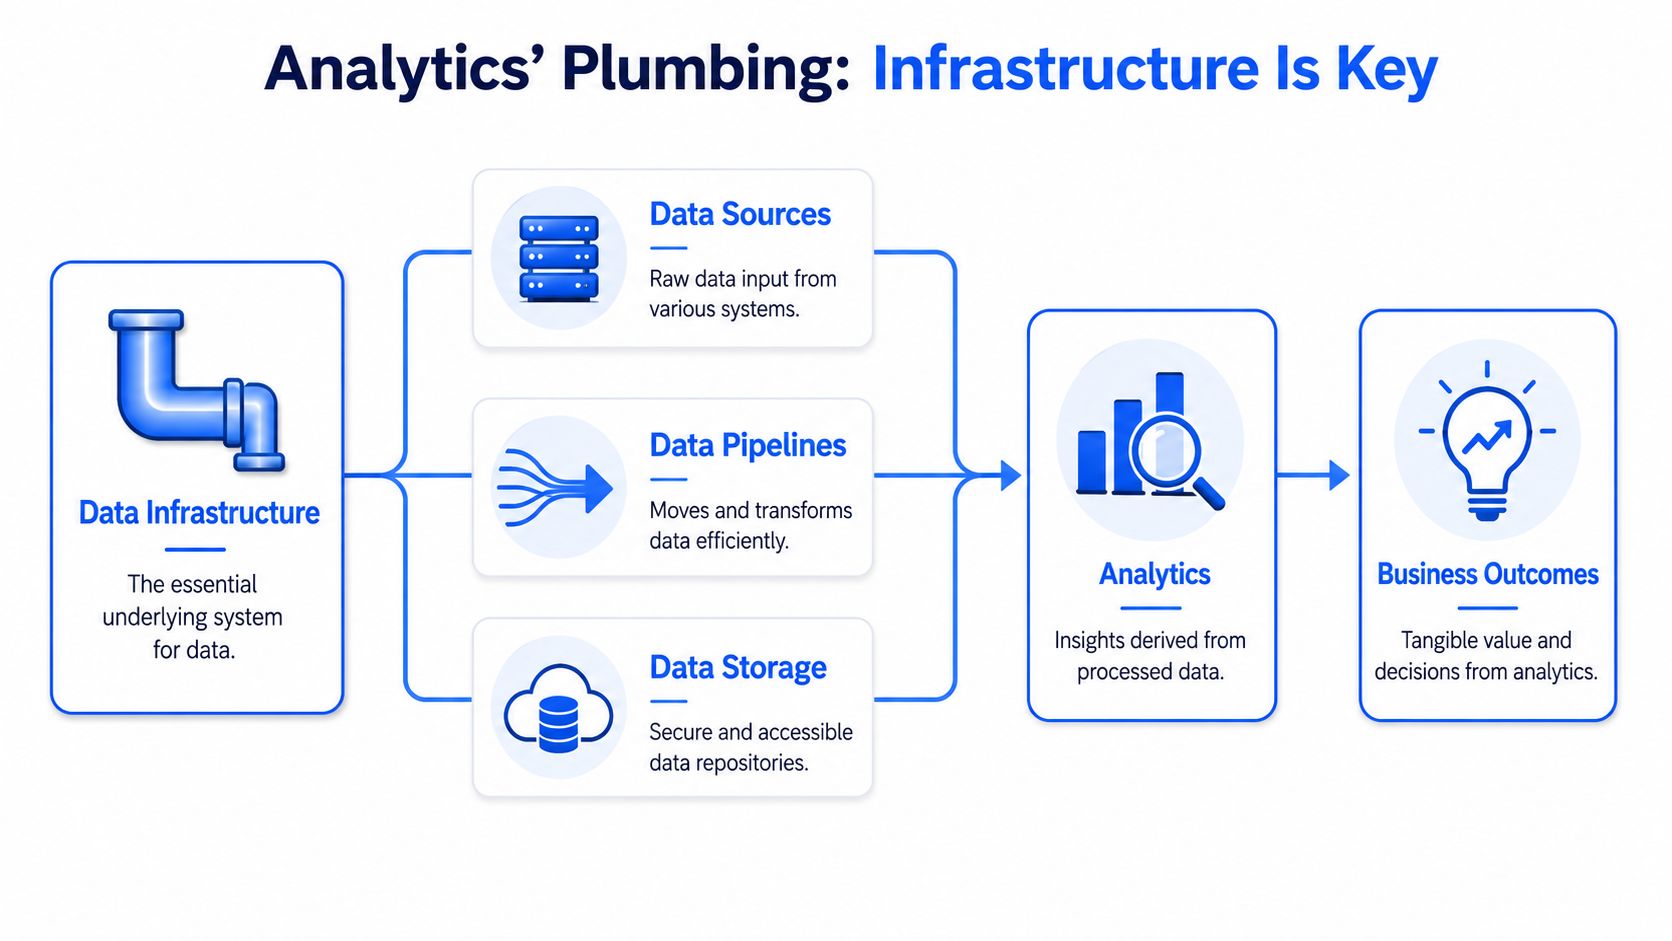
The mistake I see in growing companies is treating infrastructure as a back-room technical concern. It is a management system. If definitions, permissions, lineage, and workflows are weak, self-service spreads inconsistency faster than the data team can contain it. Legacy BI tools often make this worse because business logic lives inside dashboards, access rules are hard to reason about, and reusable work is trapped in a proprietary interface instead of a versioned workflow.
What infrastructure includes
In practice, infrastructure covers the full path from source systems to business decisions. That includes:
Data sources such as product events, CRM records, support systems, billing tools, and operational databases.
Pipelines that ingest, clean, and reshape raw data so teams can reuse logic instead of rebuilding it for each question.
Storage and compute that support both repeatable reporting and exploratory work without creating cost surprises.
Transformation and semantic logic where core business definitions are standardized and reviewed.
Governance and access controls so teams can work independently without exposing sensitive data or redefining key metrics.
Workflows for analysis including notebooks, SQL editors, AI agents, and file-based development practices that make changes testable and auditable.
The operational test is simple. Can two teams answer the same question from the same model and get the same number? Can someone trace a KPI back to source data, transformation logic, and access policy without opening five different tools? If the answer is no, the weakness sits in infrastructure, not in the chart.
That is also why the modern data stack architecture matters more than any single dashboarding tool. The stack decides where logic lives, how work is reviewed, and whether self-service scales without losing control.
Why the business feels infrastructure quality immediately
Strong infrastructure improves execution because analysts spend less time reconciling numbers and more time improving the underlying model. McKinsey has noted that companies that scale data-driven practices well tend to improve productivity and decision-making, but the gains only show up when the operating model supports consistent use of trusted data. In practice, that means fewer one-off requests, fewer metric disputes, and faster cycle times for product, finance, and go-to-market teams.
A mature setup changes day-to-day execution in a few visible ways:
Leaders get answers faster because reusable models replace hand-built analysis for every request.
Operators trust reports more because definitions are centralized and changes are documented.
Governance becomes workable because access, lineage, and review live inside the workflow instead of being bolted on after the fact.
Self-service becomes safer because AI agents and file-system notebooks can generate, test, and refine analysis against governed data rather than creating more logic silos inside BI dashboards.
This is the strategic shift. The data team stops operating like a service desk and starts running a platform. That platform has to support speed and control at the same time. If it only optimizes for speed, metric sprawl follows. If it only optimizes for control, the business routes around it.
Practical rule: If your data team spends more time explaining numbers than improving shared models, your infrastructure is underbuilt.
The investment case has changed as well. Infrastructure is now tied to growth, operating discipline, and how many decisions the company can make without adding analyst headcount in lockstep. For founders planning major platform investment, resources that help you search for IT infrastructure funding can be useful because the spend supports scale, governance, and faster execution.
Exploring the Core Components of a Modern Data Stack
Most leaders don't need a vendor catalog. They need a mental model. The cleanest one is to separate the stack into four layers and judge each layer by the business problem it solves.
A modern stack also shouldn't be assembled by trend chasing. Teams often overbuy tooling in one layer while leaving a weaker foundation below it. That's how you end up with elegant dashboards sitting on fragile pipelines.
The four layers that matter
Ingestion is how data enters the system. This includes application databases, SaaS connectors, event tracking, and reverse ETL sources. Common tools vary by environment, but the core design question is always the same: are you moving data in a way that's observable and easy to maintain?
Storage is the center of gravity. Most strategic decisions reside here because storage architecture determines access patterns, cost behavior, and the kinds of workloads you can support.
Transformation turns raw records into business-ready models. This layer is where teams define revenue, active users, churn logic, and product usage concepts in a reusable way. If transformation is weak, self-service becomes a guessing game.
Visualization and analytics is where people consume data through dashboards, notebooks, semantic layers, SQL editors, and increasingly conversational or agent-driven workflows.
For readers comparing stack patterns, this overview of the modern data stack is a useful companion because it frames the stack as an operating model rather than a list of apps.
Data storage architectures compared
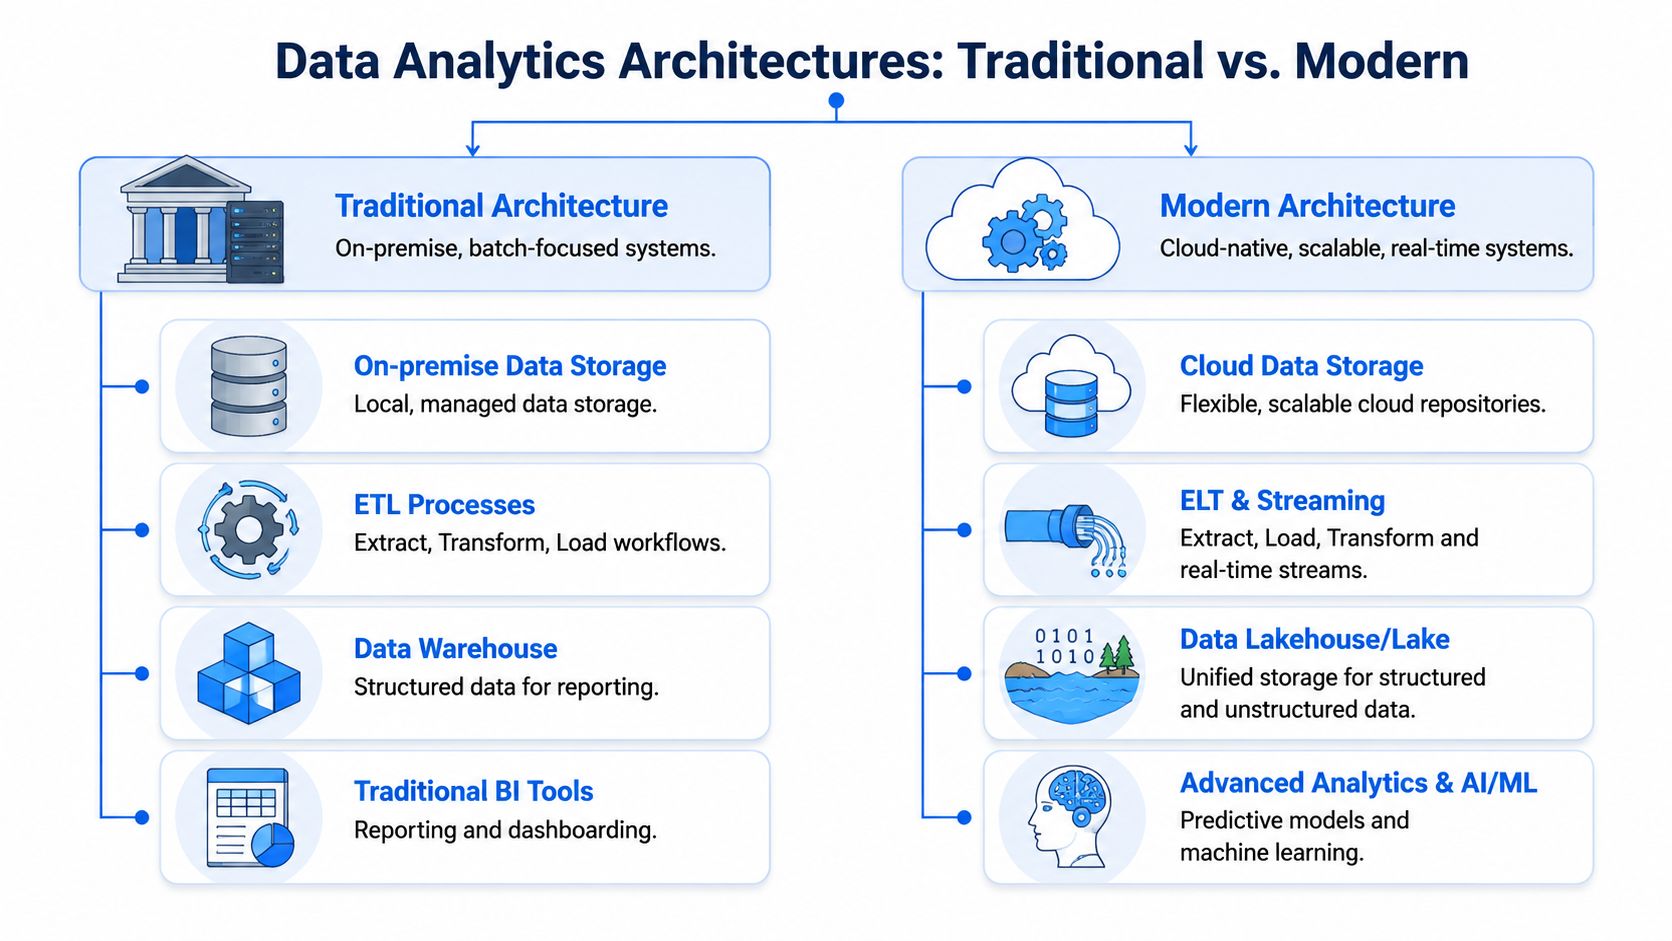
The storage choice deserves its own table because it shapes almost everything above it. A modern data infrastructure for analytics typically uses data warehouses for structured SQL analysis, data lakes for flexible storage of structured and unstructured data, and data lakehouses to combine warehouse-style query performance with lake-scale flexibility, as described in Quadratic's breakdown of modern data infrastructure architectures.
Architecture | Best For | Data Type | Key Feature |
|---|---|---|---|
Data Warehouse | Standardized reporting, finance metrics, SQL-heavy analytics | Structured | Strong performance for governed analytics |
Data Lake | Raw event data, logs, files, machine data, mixed use cases | Structured and unstructured | Flexible storage for large and varied datasets |
Data Lakehouse | Teams that want warehouse-style querying with lake flexibility | Structured and unstructured | Combines scalable storage with stronger analytical access |
A few trade-offs matter in practice:
Warehouses work well when the business needs consistent reporting, KPI governance, and predictable SQL access.
Lakes work well when teams need to retain raw data in many formats and don't want to model everything upfront.
Lakehouses work well when a company wants one environment that supports both governed reporting and broader analytical workloads.
Storage also affects latency design. Batch pipelines are often enough for historical analysis and board reporting. Streaming or hybrid patterns matter when teams need analysis-ready data with lower latency for operations, product monitoring, or customer-facing experiences.
Choose the storage architecture that matches your dominant decision pattern. Don't choose one because the market likes the label.
Choosing the Right Data Analytics Architecture
Architecture debates often get framed as old versus new. That's too simplistic. The better question is which model gives your company enough control today without making growth painful later.
For most mid-market companies, the choice lies between a centralized architecture and a more decentralized operating model. Both can work. Both can fail badly if applied at the wrong stage.
A simple visual helps clarify the difference.
Why centralized usually wins first
A centralized model puts ownership of pipelines, core models, and KPI logic in one data team. That team curates source integration, transformation standards, access rules, and reporting definitions.
For a growing company, this usually works better at first for three reasons:
It reduces ambiguity because one group owns metric definitions.
It lowers security risk by keeping access and governance in a smaller control surface.
It simplifies execution when the company still has a limited set of core business questions.
This is why a hub-and-spoke model remains common. Product, finance, and go-to-market teams consume shared models rather than building from scratch. The trade-off is obvious. As demand increases, the central team becomes a bottleneck.
A CEO should accept that bottleneck early if it buys consistency. What shouldn't happen is staying in that mode too long.
When decentralization starts to matter
Decentralization becomes useful when the business has multiple domains with different analytical needs and enough local expertise to own part of the logic. Product analytics, revenue analytics, support analytics, and operational analytics often mature at different speeds. At that point, a single central queue starts slowing everyone down.
The mistake is treating decentralization as permissionless sprawl. It isn't. Good decentralization keeps a central platform layer for storage, governance, shared definitions, and access controls while allowing domain teams to build on top.
A practical split often looks like this:
Central team owns the warehouse, ingestion standards, semantic definitions, security, and reusable models.
Domain teams own local analysis, operational dashboards, experiments, and domain-specific logic.
Leadership owns the escalation rule for what becomes a company KPI versus what stays local.
For teams evaluating design choices in more detail, this guide to data warehouse architectures is helpful because it grounds the architecture decision in workload and governance, not slogans.
Centralize the platform. Decentralize the questions.
That balance is where most healthy analytics organizations land.
Solving Common Self-Service Analytics Challenges
Self-service analytics sounds simple until people start using it.
The usual rollout goes like this. A company buys a BI tool, opens access to more teams, and expects analyst demand to fall. Instead, the queue changes shape. Fewer people ask for basic charts, but more people ask why two dashboards disagree, whether a metric is “official,” or which SQL query should be trusted. The service desk doesn't disappear. It moves upstream into governance.
Why self-service often fails
The gap is well described in Domo's discussion of data infrastructure and analytics. Most guidance tells companies to enable self-service and centralize data sources. It rarely addresses the operational governance needed to keep self-service from creating fresh bottlenecks. Without defined metrics and versioned logic, non-technical users can create inconsistent results and weaken trust in the system.
This is the core issue. Access is easy. Consistency is hard.
Three failure patterns show up repeatedly:
Metric drift. Marketing defines qualified pipeline one way, finance another, and sales operations uses a third variation that started as a quick workaround.
Logic duplication. Analysts copy transformations across dashboards or notebooks because the shared model doesn't contain the exact field they need.
Shadow analysis. Teams save local spreadsheets, one-off SQL, or untracked notebooks that answer immediate questions but never become governed assets.
If self-service starts with tool permissions instead of metric governance, the clean-up bill arrives later.
What governed self-service looks like
A workable model starts with constraints, not freedom. That sounds counterintuitive, but it's what lets more people move safely.
Use a small set of operating rules:
Define the business layer early
Decide what counts as revenue, active customer, churned account, trial conversion, and similar company-level metrics. Put those definitions in a reusable semantic layer or governed transformation layer.Version the logic
SQL models, notebook code, and business definitions need change history. If the logic that powers a KPI can't be reviewed or rolled back, it shouldn't be considered production-grade.Separate certified from exploratory work
Not every notebook or dashboard needs executive status. Mark what is governed and what is exploratory so teams can move quickly without confusing experimentation with official reporting.Design access by job to be done
Product managers don't need the same interface as analytics engineers. Finance users may need tightly modeled reporting. Data scientists may need lower-level access. One tool for everyone usually creates friction for everyone.
A practical implementation path matters too. Teams that are early in this journey can use this self-service analytics implementation guide to think through permissions, ownership, and rollout order.
The shift you want is cultural as much as technical. The data team stops acting like a human API. It becomes the platform team for trusted internal decision-making.
A Practical Guide to Data Infrastructure Migration
Monday starts with a familiar escalation. Finance cannot reconcile revenue between the board deck and the dashboard. Product has a different active-user number in a notebook. The data team spends the day tracing logic across BI tools, ad hoc SQL, and spreadsheet exports instead of fixing the system that caused the confusion.
That is the point where migration becomes an operating priority. The underlying cost is not an outdated stack diagram. It is delayed decisions, duplicated work, and governance that breaks under self-service demand.
The business signals that force a move
The trigger is usually operational, not architectural. Executives see slower planning cycles. Analysts spend more time reconciling than analyzing. Business teams work around the official stack because getting an answer through the approved process takes too long.
A few patterns show up repeatedly:
Reporting cycles slip because data must be joined manually across tools and teams.
Metric disputes keep resurfacing because core definitions live in dashboards, local notebooks, or tribal knowledge.
The data team becomes a ticket queue for every follow-up question, which limits self-service and burns time on low-value work.
Governance gets weaker as usage grows because access, definitions, and review processes were designed for a small analyst group, not company-wide use.
Teams create shadow workflows in spreadsheets, CSVs, and side databases when the governed path is too rigid for day-to-day decisions.
Infrastructure spending keeps rising across the market, as noted earlier. That matters for one reason. CEOs need to know whether current spend is buying faster decisions and safer self-service, or just preserving complexity.
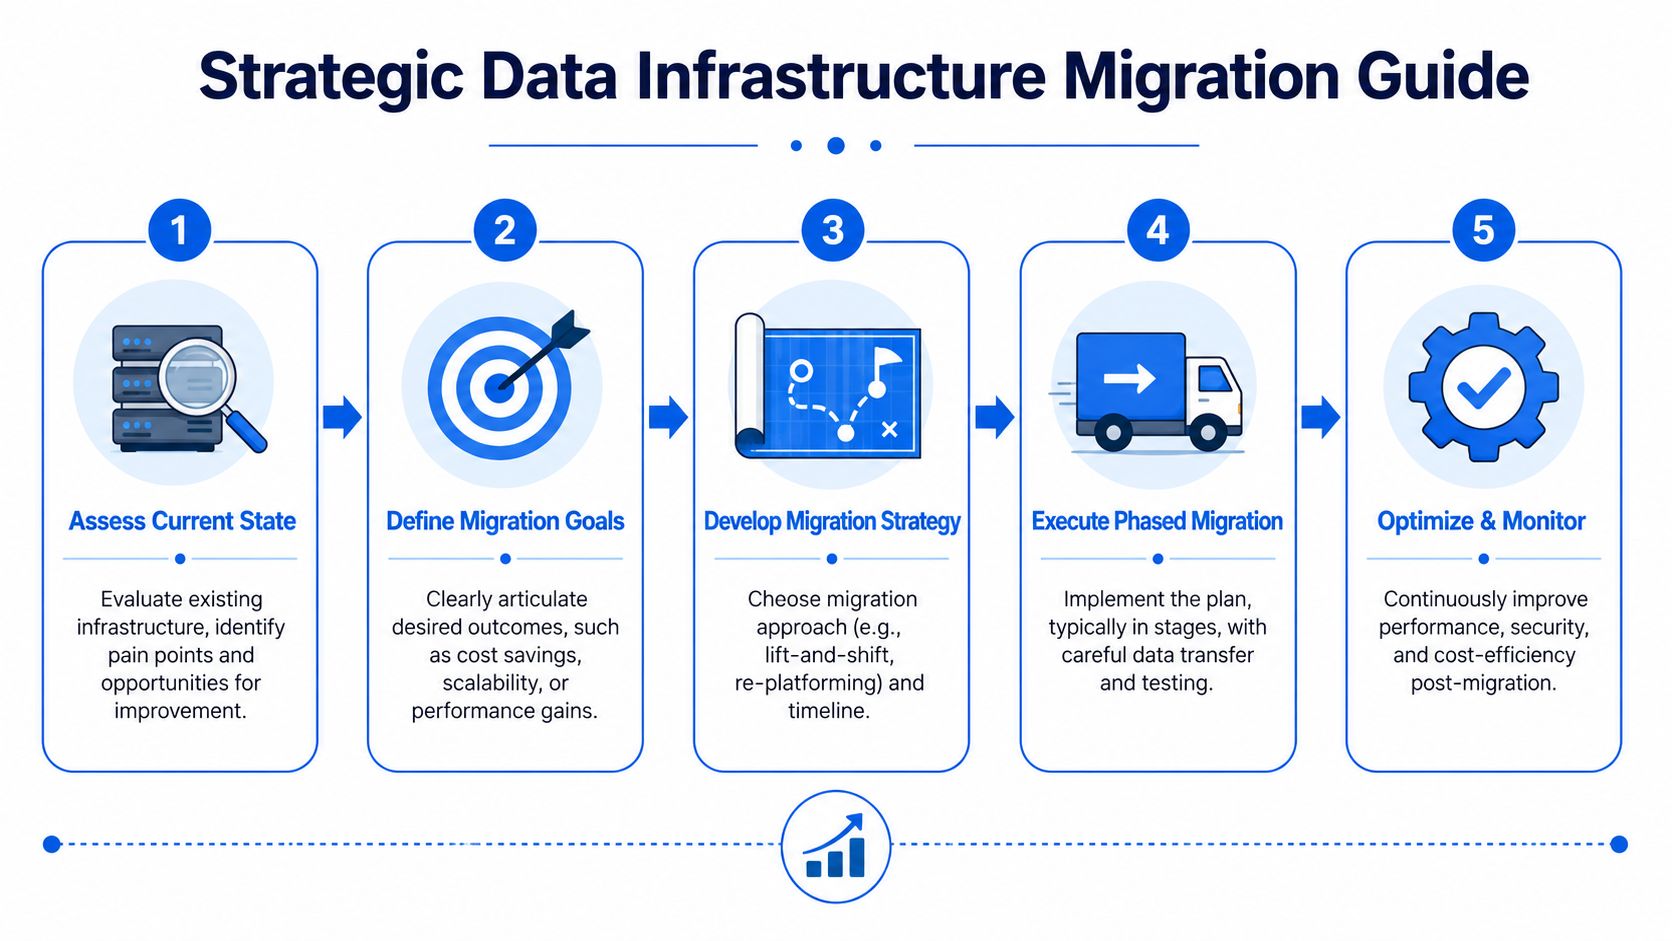
Migration paths that work in practice
Two paths tend to work.
Lift-and-shift fits teams whose core models are sound but whose current environment is costly to run or hard to maintain. It reduces platform risk first, then improves workflows over time.
Phased modernization fits teams that have a bigger structural problem. The stack may depend on brittle dashboards as the business logic layer. Notebook work may sit outside review and version control. Governance may rely on a small group of analysts manually approving every change. In that case, migration should rebuild the workflow, not just move it.
The sequence matters more than the vendor list:
Start with a high-value workflow such as revenue reporting, board metrics, or product usage analysis.
Rebuild shared logic before dashboards so certified metrics exist in one governed place.
Move notebook and agent workflows into versioned, file-based development so exploratory work can be reviewed, reused, and promoted to production without copy-paste handoffs.
Keep legacy reporting running during the transition until the new path proves accuracy, performance, and adoption.
Change the user interface last because a familiar front end can buy time while the underlying model improves.
Modern workflows prove helpful. File-system notebooks, code review, and AI agents reduce the bottleneck that legacy BI tools create in the messy middle between raw data and executive reporting. Analysts can iterate quickly. Engineering can enforce standards. Business users get faster answers without turning every question into a service request.
For leaders deciding whether to assemble tools, purchase a platform, or build key pieces internally, this buy versus build guide for analytics infrastructure gives a practical frame for the trade-offs.
Migrations work when leadership treats them as a change to operating discipline. The target state is a governed self-service platform where trusted definitions, versioned workflows, and clear ownership scale together.
How New Analytics Workflows Are Driving ROI
The old analytics workflow assumed a sharp divide between technical builders and business consumers. Engineers and analysts prepared the data. Everyone else waited for dashboards, ad hoc SQL, or a scheduled report. That model worked when questions were narrower and change moved slower.
It breaks when a company wants broad self-service without giving up control.
Why legacy BI creates a hidden ceiling
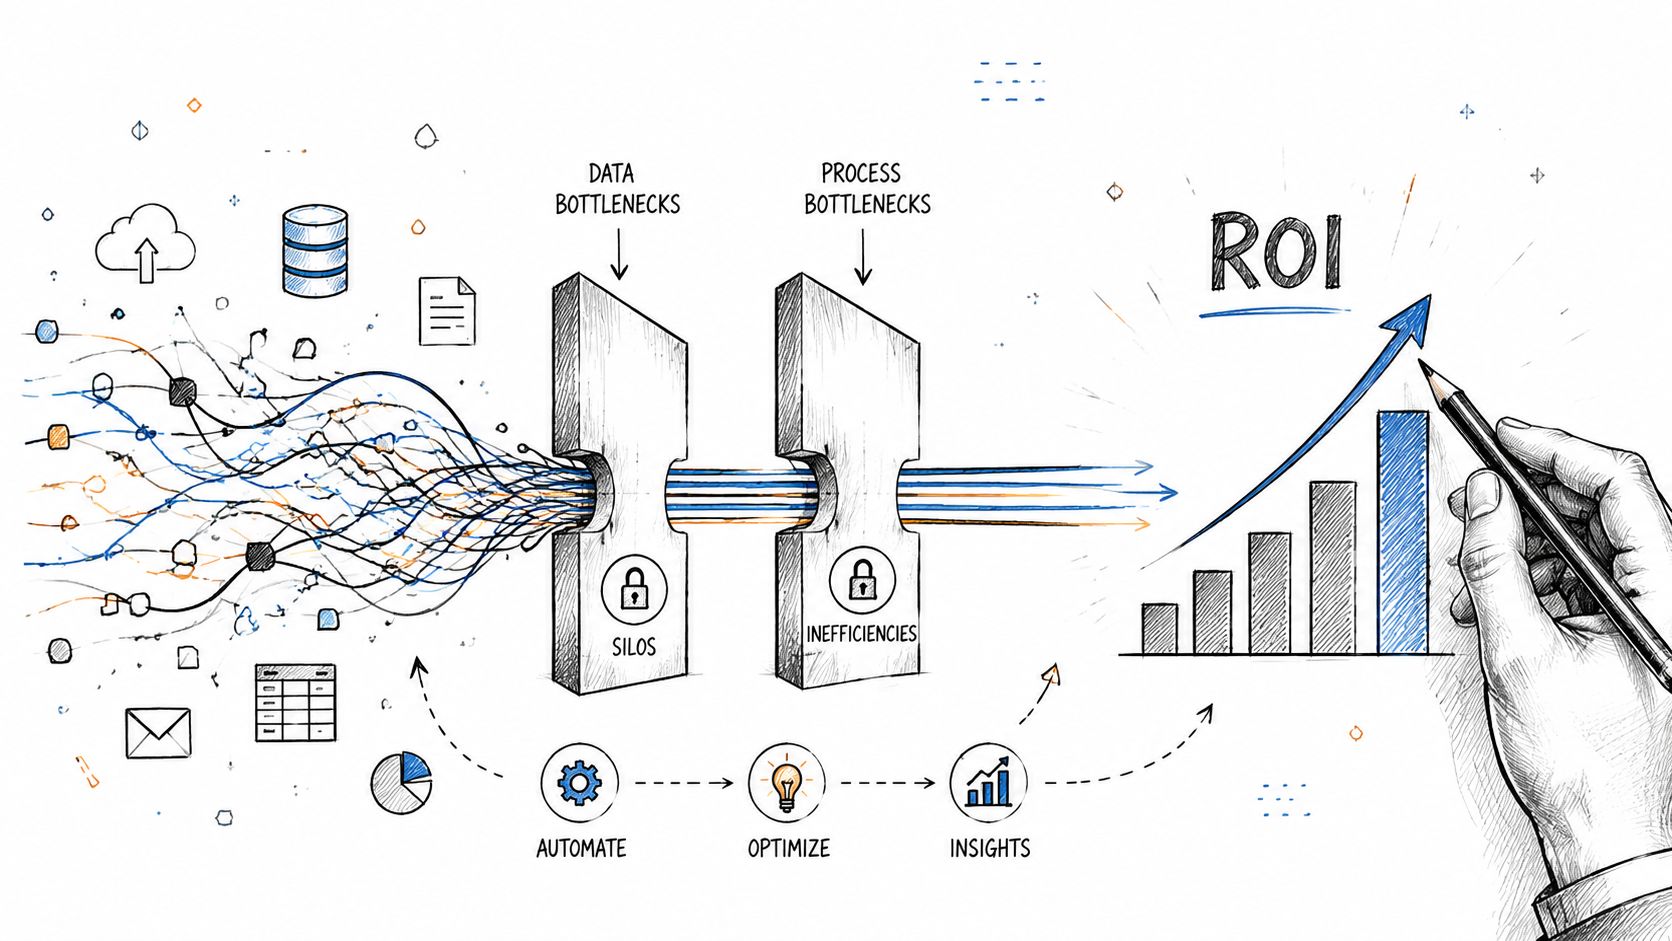
Traditional BI tools are good at distributing finished answers. They're less good at managing the messy middle where logic evolves. That middle matters because business questions don't arrive fully formed. They get refined through SQL, lightweight modeling, notebook work, and repeated iteration with stakeholders.
When those workflows live in separate tools, teams hit the same problems over and over:
The dashboard is polished but rigid. A useful follow-up question requires an analyst.
Notebook work is flexible but isolated. Logic gets reinvented because it isn't easy to govern and reuse.
The semantic layer exists, but only partially. Some definitions are official, while others live in tribal knowledge.
That's why many teams feel busy but not effective. They produce a lot of analysis, yet reuse too little of it.
What changes with agents and file-based workflows
The newer model is different. It puts analysis closer to the warehouse, treats logic as a versioned asset, and uses AI to reduce manual querying without bypassing governance.
AI agents and file-system notebook patterns are important. If an agent works directly against the warehouse and respects governed definitions, it can help users explore trusted data without creating another copy of the truth. If notebooks are treated like files in a managed system rather than personal scratchpads, teams can review, reuse, and improve logic over time.
That combination solves a real bottleneck:
Business users can ask more questions directly without waiting for an analyst to translate every request.
Data teams can govern the underlying logic because definitions, joins, and transformations stay attached to shared infrastructure.
Reusable analysis compounds because notebook workflows can be version-controlled, reviewed, and operationalized.
One example of this model is Querio, which runs AI coding agents directly on the data warehouse and uses a file-system approach with custom Python notebooks so technical and non-technical users can query and build on company data without copying it into disconnected tools.
The goal isn't to remove analysts from the process. It's to move them up the stack, from answering repetitive questions to designing reliable analytical systems.
For a CEO, the ROI case is straightforward even without forcing a spreadsheet model. Faster access to trusted data improves decision speed. Better governance reduces metric disputes. A reusable workflow lowers dependency on a small number of experts. And when technical and non-technical teams can build on the same governed foundation, analytics becomes part of how the company operates, not a department people wait on.
If your team is stuck between analyst bottlenecks and messy self-service, Querio is worth evaluating. It connects directly to the warehouse, supports governed analysis through a semantic layer and notebook workflow, and helps data teams shift from request handling to platform ownership.

