Hypothesis Testing Explained: Master Data Decisions
Get hypothesis testing explained for product & analytics leaders. Learn concepts, tools, & pitfalls for better data-driven decisions in 2026.
https://www.youtube.com/watch?v=DUNk4GPZ9bw
published
Outrank AI
hypothesis testing explained, data analytics, product management, a/b testing, statistical significance
e8c779ab-079e-4f7f-98af-c546f73ccf0b

You shipped a new onboarding flow last week. Activation looks better in the dashboard. Sales is excited, design wants to roll it out everywhere, and engineering wants to move on.
Then someone asks the question that matters. Did the change work, or did you just get a noisy week of data?
That's where teams usually split. One group trusts instinct. Another waits for a data scientist to translate statistics into a business decision. Good hypothesis testing closes that gap. It gives product managers, founders, and analytics leaders a disciplined way to decide whether an observed change is likely real enough to act on.
If you're trying to build that judgment, or you want to upskill with an MBA in Data Science while staying grounded in practical product work, hypothesis testing is one of the core ideas worth mastering. You don't need a PhD. You need a clean mental model, a few key terms, and an understanding of where teams make avoidable mistakes.
Table of Contents
From Gut Feel to Data-Driven Did That Change Actually Work
Most product decisions don't happen in a lab. They happen in Slack threads, launch reviews, and weekly standups where people are under pressure to move fast. A chart ticks up, and someone says the experiment won. A metric dips, and someone calls for a rollback.
The problem is that small samples are noisy, user behavior shifts for reasons unrelated to your change, and short-term movement often looks more meaningful than it is. Hypothesis testing is the discipline that forces a better question. Not "did the number move?" but "is the evidence strong enough to conclude the change likely made a real difference?"
For startup teams, that distinction matters because every false conclusion has a cost. You can ship a bad idea because a random fluctuation looked promising. Or you can kill a useful idea because the effect was subtle and your test wasn't designed well enough to detect it.
Practical rule: Treat hypothesis testing as a decision framework, not a math ritual.
A strong product manager doesn't need to derive formulas by hand. But they do need to understand what assumptions the team is making, what level of risk is acceptable, and whether the reported result is meaningful for the business.
That's the useful version of hypothesis testing explained. Not academic vocabulary for its own sake. A way to answer real operating questions with more discipline than gut feel.
The Core Idea A Courtroom for Your Data
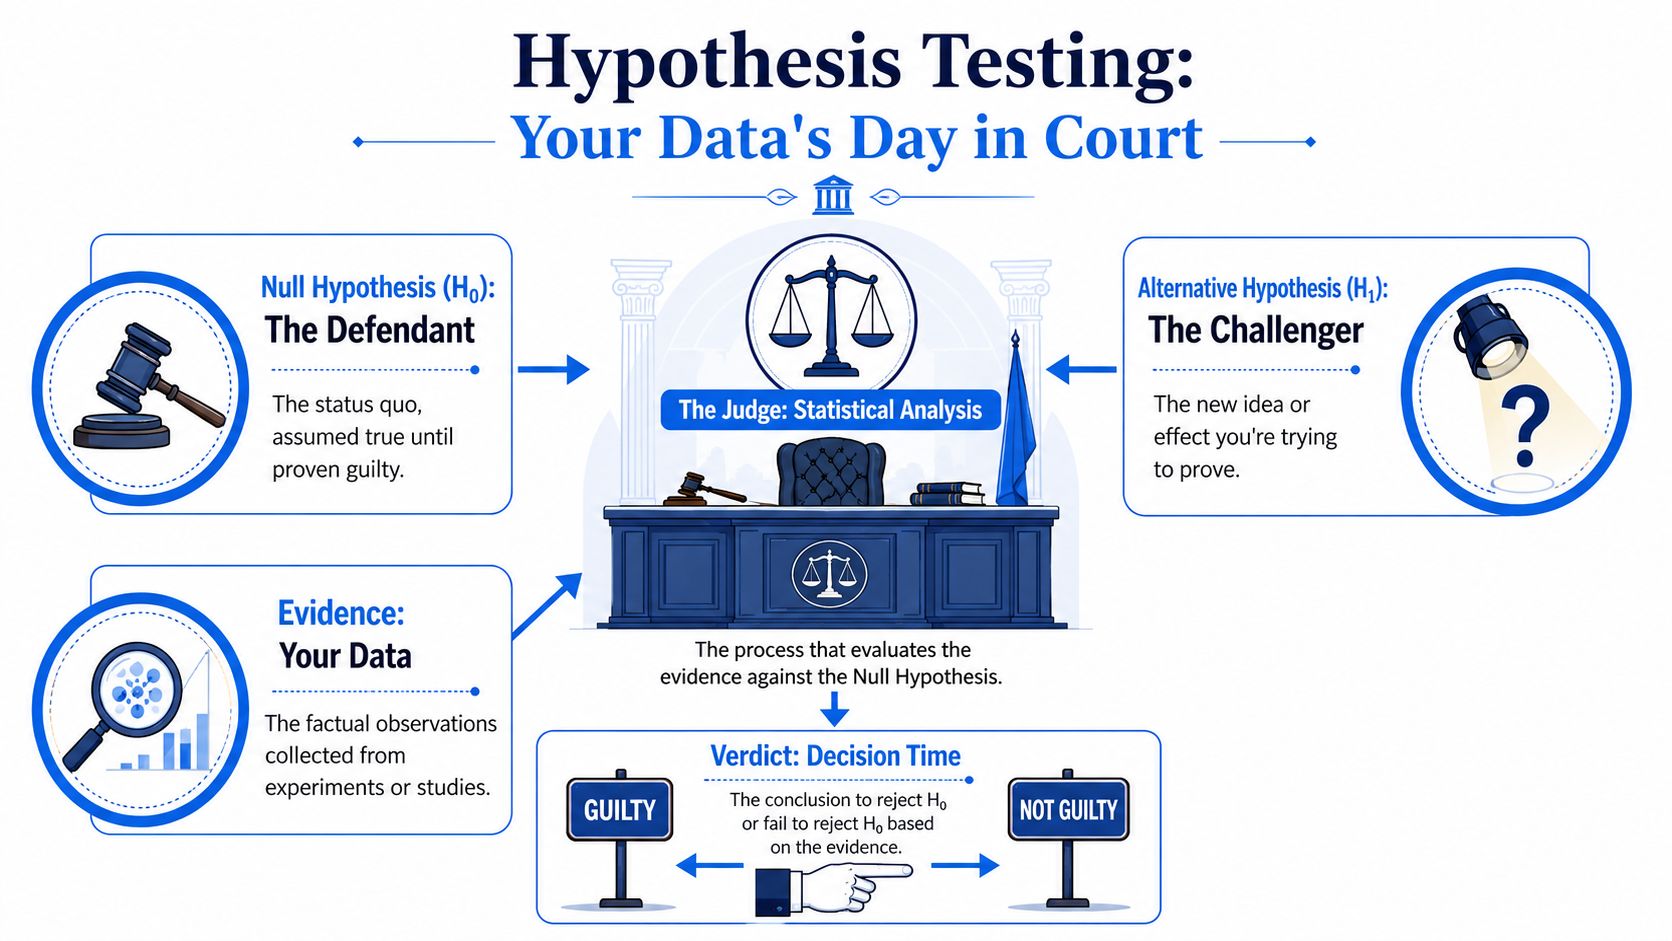
Hypothesis testing works like a courtroom trial, but the part that matters for product teams is the decision rule.
Before anyone looks at the results, the default position is conservative. The null hypothesis, written as H₀, says the change made no difference. In a startup context, that usually means your new onboarding flow, pricing page, or recommendation model performed no differently from the current version. The alternative hypothesis, written as Hₐ, says there is a real effect.
Why the null starts on top
In a trial, the burden is on the side making the claim. Product experiments work the same way. A team proposing that a feature improved conversion needs enough evidence to overcome the baseline assumption of "no meaningful change."
That starting point protects teams from expensive overconfidence. Early-stage companies often see a short-term lift and rush to ship broadly, only to learn later that the bump came from seasonality, a traffic mix shift, or plain noise. Hypothesis testing slows that down just enough to ask a better question: is this result strong enough to justify a business decision?
Here is how the courtroom comparison maps to an experiment:
H₀ is the default position. The status quo stands unless the evidence is strong.
Hₐ is the claim under review. The change produced an effect.
Your sample data is the evidence. Usually this comes from control and treatment groups.
The test procedure is the judge's rulebook. It applies a preset standard instead of a team's enthusiasm.
If your analysts did good exploratory data analysis before running a formal test, this part gets easier. You go into the test knowing where the data is noisy, whether outliers are distorting the metric, and which segments may behave differently.
What fail to reject means
A hypothesis test ends with one of two decisions. You either reject H₀, or you fail to reject H₀.
That wording frustrates people at first because it sounds evasive. It is precise for a reason. Failing to reject the null does not mean the feature had no effect. It means the experiment did not produce enough evidence to rule out "no effect" as a plausible explanation.
For product teams, this is one of the most expensive points to misunderstand.
Suppose a checkout redesign lifts conversion by 1.2%, but the test ran for only five days and traffic was thin. A non-significant result in that case may reflect low sample size, noisy behavior, or an effect too small for the current test to detect with confidence. The right takeaway is often, "we do not know yet," not "this idea failed."
That distinction is where statistical theory meets startup reality. Teams rarely have unlimited traffic or time. You are constantly trading off speed, sample size, and sensitivity. A small but valuable improvement can be missed if the test is underpowered. A statistically significant lift can still be too small to matter after engineering cost, rollout risk, or margin impact.
Failing to reject the null is not proof of no effect. It is a statement about the strength of the evidence you collected.
Read that sentence like a manager deciding what to fund next. If the evidence is weak, the next move might be to run the test longer, tighten the metric, reduce noise, or decide that the possible upside is too small to pursue. Hypothesis testing is useful because it helps teams make those trade-offs explicitly instead of treating every result as a win or a loss.
The Statistical Toolkit Key Concepts Demystified
Once the courtroom logic clicks, the core terms become easier to understand. You don't need textbook phrasing. You need working definitions you can use in a product review.

P-value as fluke detection
The p-value asks a focused question: if the null hypothesis were true, how surprising would data like this be?
In plain language, it's the odds of seeing evidence at least this extreme if there were really no effect. Lower p-values mean your observed result would be harder to explain as random noise alone.
That's why product teams often describe it informally as the probability of a fluke, though the more precise definition matters when you're speaking with analysts. It isn't the probability that your feature failed. It isn't the probability that the null is true. It's a measure of how compatible your data is with the null assumption.
Alpha as your risk threshold
Before you look at the result, you set a threshold called the significance level, or alpha (α). This is the bar your evidence has to clear.
In expert hypothesis testing, α is the maximum acceptable false positive rate, meaning the probability of rejecting the null when it is true. Standard benchmarks are α = 0.05 or α = 0.01, and a result is statistically significant only when p ≤ α, as described in Wikipedia's overview of statistical hypothesis testing.
For a product manager, alpha is a risk policy. If you choose 0.05, you're saying you're willing to accept a limited chance of concluding there was an effect when there wasn't one.
A smaller alpha makes your standard stricter. That reduces false alarms, but it also makes it harder to detect real effects.
Test statistic as compressed evidence
The test statistic is a single number that summarizes how far your observed data is from the "no effect" world described by H₀.
You don't need to memorize formulas to use this well. What matters is the role it plays. Analysts compute the test statistic from the data, compare it against what would be expected under the null, and use that to derive the p-value.
If you want a simple workflow for structuring the problem before analysis, the GOST protocol is useful:
Groups. Are you comparing like with like?
Outcome. What measurable result are you evaluating?
Summarise. How will you summarize each group?
Test statistic. What statistic will evaluate the likelihood of the null?
The protocol comes from a practical overview in PMC's discussion of significance testing and interpretation. It's a strong guardrail because many bad tests start before the math. Teams compare mismatched cohorts, use vague outcomes, or summarize the wrong thing.
Working advice: If you can't clearly define the groups and the outcome, don't trust the p-value yet.
If you want a complementary foundation before formal testing, it helps to review exploratory data analysis basics. Good hypothesis testing usually starts with good data inspection, not blind calculation.
A practical checklist before you run the math
When a PM asks for hypothesis testing explained in practical terms, this is the simplest useful sequence:
State H₀ clearly. Example: the new signup flow does not change completion behavior.
State Hₐ clearly. Example: the new signup flow changes completion behavior.
Choose α before seeing results. Don't move the goalposts after the test.
Compute the test statistic and p-value.
Apply the decision rule. If p is less than or equal to α, reject H₀. If not, fail to reject it.
That decision rule is the operational core. The rest of the craft lies in choosing the right test and interpreting the outcome responsibly.
Choosing Your Weapon A Guide to Common Statistical Tests
Most non-statisticians get stuck on the wrong question. They ask, "Which formula do I use?" The better question is, "What kind of comparison am I trying to make?"
Different tests exist because business questions come in different shapes. Some compare averages. Others compare proportions or category distributions. The choice should follow the question.
Common Hypothesis Tests and When to Use Them
Test Name | Business Question | Example Use Case |
|---|---|---|
T-test | Are the averages of two groups different? | Compare average revenue per user between users who saw onboarding version A and version B |
Z-test for proportions | Are two rates or proportions different? | Compare signup completion rate between a control flow and a redesigned flow |
Chi-square test | Did the distribution across categories change? | Check whether users shifted across pricing tiers after a packaging update |
ANOVA | Are there differences across more than two group averages? | Compare average engagement across several landing page variants |
A t-test is often the default for comparing the average outcome of two groups. If you're working with rates, such as conversion or completion, teams frequently use a proportion-based test. If the outcome is categorical, such as which plan users choose, chi-square is often the right fit. If you have several variants rather than two, ANOVA is designed for that setting.
How product teams usually choose the wrong test
The most common mistake isn't a tiny formula error. It's a mismatch between the metric and the test.
A few examples:
Average versus rate confusion. Teams test conversion rate with a method built for continuous averages.
Too many variants, pairwise chaos. A team launches several page versions and runs a string of disconnected two-group tests instead of using an approach designed for multiple groups.
Category data treated as numeric. Plan selection, survey response buckets, and device classes get forced into average-based tests that don't fit the structure of the data.
If your team uses t-tests regularly, this deeper guide on what the t-test is used for can help clarify where it fits and where it doesn't.
A practical way to think about test selection is to ask two questions:
What is the shape of the outcome? Average, rate, or category?
How many groups are being compared? Two or many?
Those two answers usually narrow the choice quickly enough to have a productive conversation with your data team.
Beyond the P-value Errors Power and Business Impact
A hypothesis test is never just a statistical exercise. It is a controlled way to take risk.
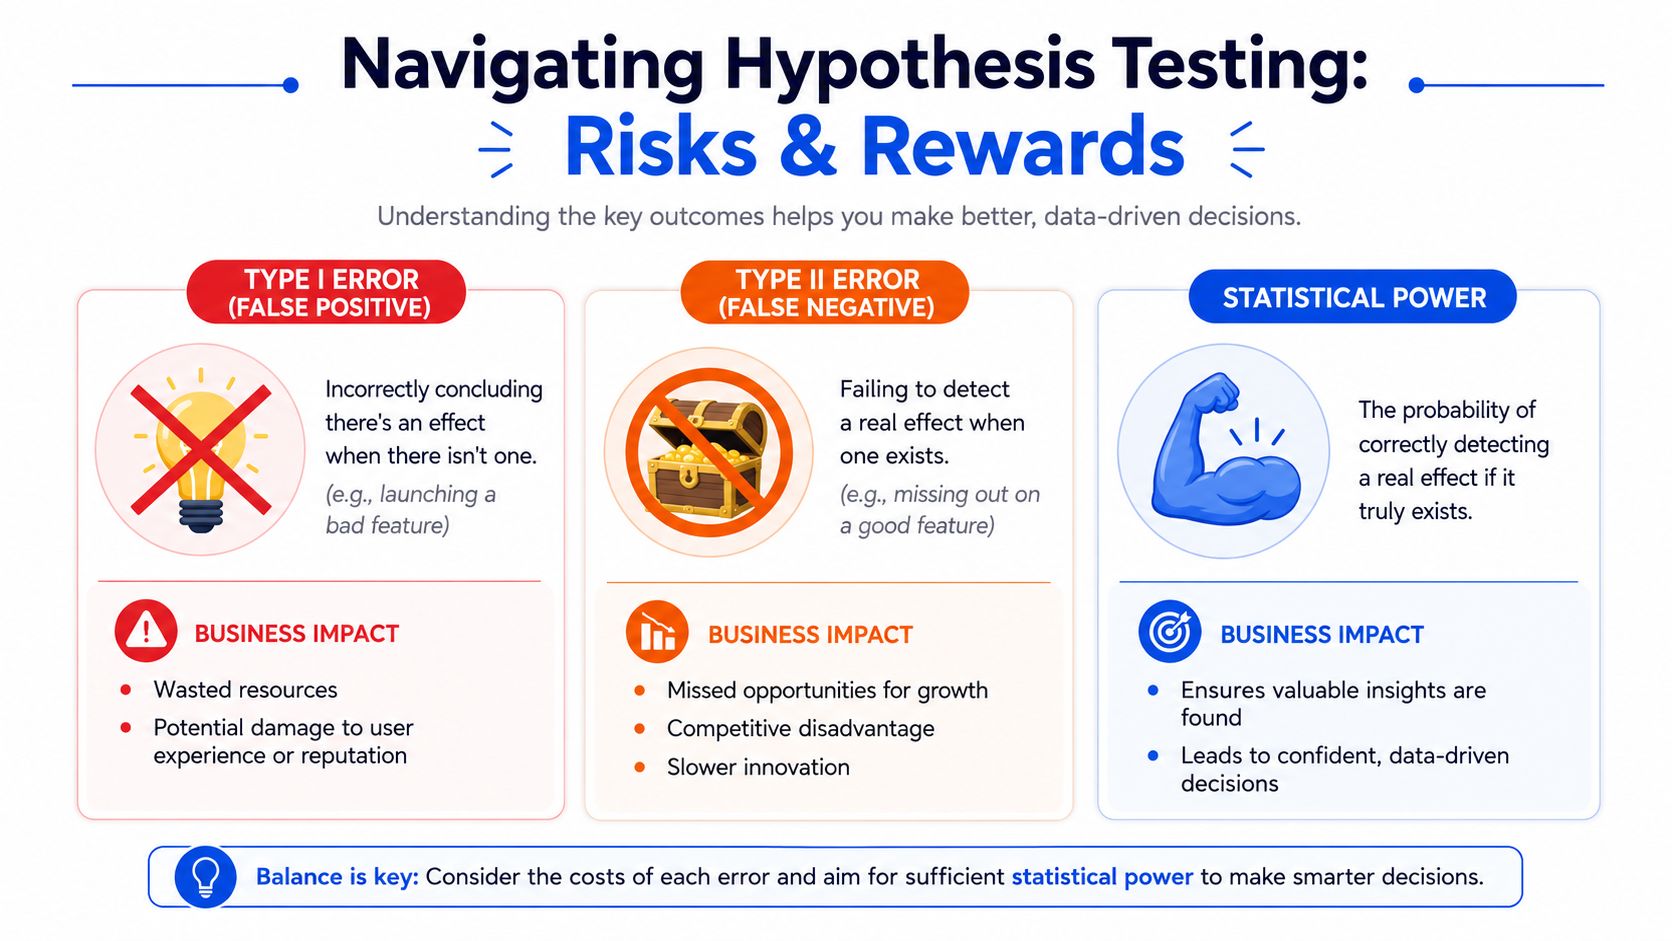
Every experiment exposes your team to two different kinds of mistakes. One pushes you to act when you shouldn't. The other causes you to miss an opportunity.
Two ways a team can get burned
A Type I error is a false positive. Your team concludes the feature worked when it did not. In product terms, that can mean rolling out a bad search ranking tweak, pushing a weaker email sequence into production, or reallocating roadmap time based on noise.
A Type II error is a false negative. A real effect exists, but your test misses it. The team scraps a useful onboarding change because the data wasn't strong enough to detect the lift.
These aren't academic failure modes. They're operating mistakes with roadmap consequences.
A false positive wastes effort. A false negative wastes opportunity.
There's also a second distinction product teams often miss. Statistical significance isn't the same as business significance. A result can be statistically reliable and still too small to matter for revenue, retention, or user experience. The practical article on significance testing in Grumspot's guide that helps demystify statistical significance testing is a useful companion for that judgment call.
Power and MDE in a startup reality
Startup constraints frequently hit hard. You may have the right hypothesis, a clean metric, and a sensible test, but still lack enough users to detect a meaningful change.
Statistical power is the probability of detecting a real effect if one exists. More data generally increases power. It also helps you detect smaller effects. That leads directly to minimum detectable effect, or MDE, which is the smallest effect size worth and feasible to detect in your experiment design.
For startup teams, MDE forces a strategic conversation early. What is the smallest change that would matter to the business? If the answer is tiny, you may need a sample size your traffic can't support. If the answer is larger, you can design a more realistic test.
This issue is widely underexplained in beginner material. A projected 2025 industry report cited by Statsig says 78% of A/B tests in mid-market startups fail to reach adequate power because of undersized samples, and it notes that few guides explain MDE clearly beforehand in planning (Statsig on hypothesis testing and startup experiment design).
That matters because underpowered tests create busywork. Engineers ship the experiment, PMs wait, analysts report inconclusive findings, and nobody learns enough to decide confidently.
If p-values still feel slippery in these contexts, this guide to p-value interpretation for business decisions is a useful next read.
Hypothesis Testing in Action A Real-World A-B Test
A clean example makes the abstract parts easier to trust. Say your growth team changes the homepage headline and wants to know whether the new version increases engagement after signup.

The business question
The team randomly assigns users to headline A or headline B.
H₀: The new headline does not change engagement.
Hₐ: The new headline changes engagement.
Suppose the outcome metric is a simple user-level engagement measure, such as activated versus not activated within a defined window. The exact metric can vary. What matters is that the team defines it before looking at results.
For teams building broader experimentation programs, the examples in these full-funnel growth strategies can help generate stronger test ideas than isolated page tweaks.
Pulling the data with SQL
A realistic warehouse query might look like this:
This produces one row per user with a variant label and a binary outcome.
Running the test in Python
You can then analyze it in Python with a simple workflow:
If the p-value is below your preselected alpha, you reject H₀. If it isn't, you fail to reject H₀ and ask whether the result was inconclusive or unpromising.
A simple chart often helps the discussion. Plot the average engagement rate for each variant side by side. Then pair that visual with the test result so nobody mistakes a visible gap for sufficient evidence.
For a quick primer in a different format, this video walks through the logic clearly:
Teams that want to operationalize this workflow without turning analytics into a ticket queue often look for more self-serve experimentation workflows. This article on how growth teams at SaaS startups use AI BI to run experiments without analytics support is one example of that shift.
The Three Biggest Pitfalls That Lead to Bad Decisions
A startup team ships a new onboarding flow, sees a p-value under 0.05, and celebrates. Two weeks later, activation is flat, support tickets are up, and engineering has spent a sprint scaling something that did not move the business in a meaningful way.
That pattern is common because the hard part of hypothesis testing is rarely the math. The hard part is deciding what the result means, what it does not mean, and whether it deserves action.
Three mistakes cause a large share of bad calls.
P-hacking: The team keeps slicing by segment, shrinking the date range, swapping metrics, or rerunning the analysis until a significant result appears.
Confusing statistical significance with business significance: The result passes the threshold for evidence, but the effect is too small to justify rollout costs, user disruption, or roadmap changes.
Treating a non-significant result as proof of no effect: The experiment fails to clear the bar, and the team concludes the change does nothing.
Each mistake sounds reasonable in the moment. Each can push a product team toward the wrong roadmap decision.
P-hacking is result shopping with a spreadsheet. It works like taking ten shots on goal and only reporting the one that went in. If your team tests enough segments or enough metrics after seeing the data, chance will eventually hand you something that looks convincing. The process feels analytical, but it raises the odds of shipping noise.
The second mistake is more subtle. A tiny lift can be statistically significant if the sample is large enough. For a startup, that does not automatically make it worth building around. If conversion rises by a fraction of a percent, a PM still needs to ask whether that gain outweighs engineering time, design effort, experiment complexity, and the risk of making the product worse for another user group.
That is where product judgment meets statistical judgment. Statistical significance asks, "Is there evidence of a difference?" Business significance asks, "Is the difference big enough to matter?" Good teams decide both before the test starts.
The third mistake causes just as much damage. Failing to reject the null does not prove the null is true. It usually means the test did not produce enough evidence for a clear call. The reason might be a small sample, a noisy metric, a weak effect, or a question that was framed too broadly.
Weak evidence against H₀ is not the same as strong evidence for H₀.
For product and analytics teams, the practical response is usually one of three moves: stop the work, run a better-powered test, or narrow the question. If a pricing change could matter a lot but the current experiment was underpowered, "no significant result" should not end the conversation. It should prompt a better experiment design.
The goal is not to win a statistics debate. The goal is to make better decisions with limited time, limited traffic, and real opportunity cost.


