10 Best Query Optimization Tools for 2026
Explore the top query optimization tools of 2026. Our review covers native tools, profilers, and AI assistants to help you speed up your database queries.
https://www.youtube.com/watch?v=aynexqleyac
published
Outrank AI
query optimization tools, sql tuning, database performance, query profiling, data engineering
3c934ab4-5b6a-49f8-9efe-13905c64b269

Slow queries don't announce themselves. They creep into dashboards, stall product reviews, and turn simple questions into support tickets. By the time someone says the database feels slow, the underlying issue is usually a mix of bad plans, stale statistics, and workload drift, exactly the kind of problem modern query optimization tools are built to expose and correct. The old cost-based foundation still matters here, because optimizers rely on statistics to estimate cardinality and choose the cheapest plan, which is why plan inspection and refreshed statistics keep showing up in serious tuning workflows Microsoft Research's classic query optimization tutorial.
Microsoft's training on Query Store describes a world where the engine captures plans and runtime information automatically, and distinguishes estimated, actual, and live query statistics for performance analysis Microsoft's Query Store training video. That shift from one-off fixes to continuous observability is central to today's tools, from native profilers to AI-assisted tuning and full-stack monitoring platforms. If you're choosing tooling for Postgres, SQL Server, Snowflake, or a mixed estate, the right answer depends less on brand name and more on how your team operates, how mature your monitoring is, and whether you need ad hoc diagnosis or ongoing regression detection.
Table of Contents
6. Microsoft SQL Server Database Tuning Advisor (DTA) + Query Store
6. Microsoft SQL Server Database Tuning Advisor (DTA) + Query Store
8. Snowflake Query Profile + Query Acceleration Service (QAS)
9. Percona Monitoring and Management (PMM) with Query Analytics (QAN)
1. EverSQL (now part of Aiven)
EverSQL is a good fit when the bottleneck is obvious, the team wants a fast answer, and there isn't a deep DBA bench to do the analysis by hand. It focuses on MySQL and PostgreSQL, and its appeal is simple, upload the query, schema, and EXPLAIN output, then get rewrite and index recommendations back without giving the service direct database access. The entry path now sits under Aiven, which makes it easier for teams already using that ecosystem to try before they standardize.
Where it works well
The strongest use case is ad hoc tuning. A developer can paste a troublesome statement, include the current plan, and get a guided recommendation instead of staring at a wall of operators. For smaller teams, that lower-friction workflow matters more than deep infrastructure coverage, because it shortens the path from “this query is slow” to “here's the next change to test.”
Practical rule: use it for short, focused optimization cycles, then validate every recommendation in staging before you touch production.
There's also a gentle on-ramp for recurring slow-query detection through the optional sensor, which makes it more useful than a pure one-shot rewrite tool. The limitation is clear, though, it's not a single control plane for a broad database estate, and it's strongest when you stay inside the Postgres and MySQL lane. For teams that want a broader workflow around query analysis, the internal guide on optimizing a query is a useful companion.
2. pganalyze
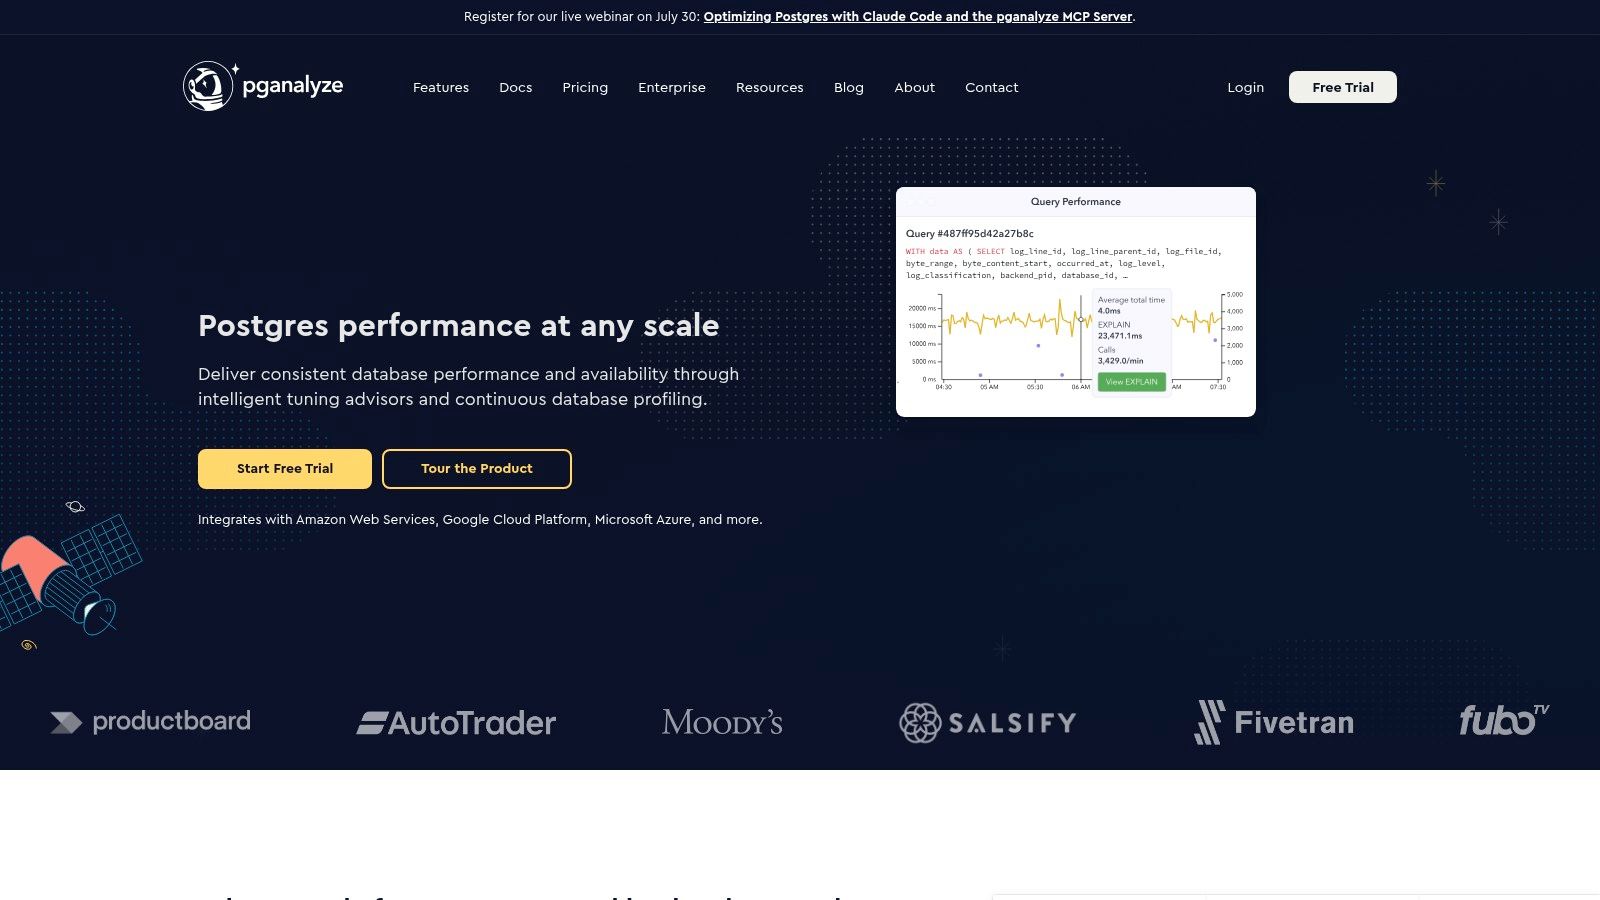
pganalyze feels like a production operator's tool rather than a query toy. It's built for PostgreSQL from the start, and that specialization shows up in the way it connects workload analysis, plan capture, log insight, and configuration guidance into one operational view. If your Postgres estate is business-critical, that focus is a strength, not a limitation.
Why Postgres teams keep it in the stack
The useful part is not just that it shows you a slow query, it helps you understand whether the query is slow because of indexing, vacuum behavior, a plan shift, or something else in the workload. Its Index Advisor and Query Advisor are aimed at actionable changes, and the plan collection and visualization features make regressions much easier to review than raw EXPLAIN output alone.
The other practical advantage is operational correlation. When query timing changes, teams need to know whether the database, the application, or a deploy is the primary cause. pganalyze is designed around that kind of investigation, which is why it tends to fit environments where the same people own both performance and reliability.
Trade-offs to accept
The obvious trade-off is scope. This is Postgres-only, so mixed estates will need another tool elsewhere. It's also a better fit for teams that are willing to instrument properly and review recommendations, not teams hoping for a fully automatic “fix it for me” button. If your organization is standardizing Postgres and wants a serious tuning layer, it's a credible choice. If you want broad multi-database monitoring, it won't cover enough ground by itself.
For teams also experimenting with natural-language analytics on Postgres, the guide on how to query Postgres with natural language AI SQL is a useful adjacent read.
3. pgMustard
pgMustard is the tool you reach for when you already have the plan and want an expert-style reading of it fast. It's intentionally narrow, centered on PostgreSQL EXPLAIN and EXPLAIN ANALYZE, and that narrowness is exactly why it works well in real life. A lot of tuning sessions don't need a giant platform, they need someone, or something, to point at the most likely bottleneck first.
Fast triage for slow plans
The interface is built around plan-centric advice, and that makes it especially handy for developers who can produce a plan but don't want to mentally parse every node. The tool surfaces optimization opportunities and ranks them by likely impact, which is useful when a plan has several suspicious-looking operators and you need to decide where to start. It also helps that it supports a wide Postgres version range, so older production systems don't immediately become orphaned.
The best use of pgMustard is to shorten the gap between plan capture and first action.
That matters because plan review is often the point where tuning gets delayed. Engineers collect EXPLAIN output, debate it in Slack, and then never circle back. A lighter tool removes that friction and keeps the conversation concrete. It's also easy to layer on top of an existing monitoring stack, since it doesn't try to replace observability or alerting.
What it doesn't replace
pgMustard is not a monitoring suite. It doesn't continuously watch your workload and tell you when a regression appears, so it assumes someone has already identified a candidate query. That makes it ideal for analysis, not surveillance. It's also Postgres-only, so if your team is juggling SQL Server, MySQL, or warehouse workloads, you'll need complementary tooling elsewhere.
For mature teams, that's fine. The right pattern is often a broad observability layer plus a focused plan interpreter. pgMustard fits neatly into that second role.
4. SolarWinds Database Performance Analyzer (DPA)
SolarWinds DPA is one of the more established choices when you need cross-platform database visibility instead of a single-engine specialist. It's built around wait-time analysis, historical trending, and root-cause isolation, which makes it useful for teams that support multiple engines and need one place to compare them. That broad coverage is a real advantage in environments where SQL Server, Oracle, MySQL, and Postgres all coexist.
Why enterprise teams pick it
The biggest selling point is breadth. DPA covers major relational databases and cloud variants, so it works better than point tools when your bottleneck could be in any part of the estate. Historical and real-time views are useful for tracking whether a problem is a one-off spike or part of a pattern, and that matters when capacity planning and incident response share the same team.
A tool like this is less about clever rewrites and more about operational accountability. It gives DBAs and platform engineers the evidence they need to defend a change, explain a regression, or prioritize the database that is causing user pain. In a cross-functional setting, that evidence often matters more than the recommendation itself.
Where the friction shows up
The trade-off is heaviness. Enterprise monitoring products usually mean more deployment effort, more configuration, and more operational overhead than a single-purpose analyzer. Licensing also tends to require a quote, which means buyers need to justify the spend against the amount of estate they're managing. That can be worth it for large teams, but overkill for a single Postgres service or a small SQL Server deployment.
If your team needs a database command center rather than a query helper, DPA fits. If you want a lightweight optimizer for one application, it's probably too much platform.
6. Microsoft SQL Server Database Tuning Advisor (DTA) + Query Store
SQL Server teams often already have two native tools available, and they do not always use them well. Database Tuning Advisor recommends indexes, indexed views, and partitioning from a captured workload, while Query Store records query texts, plans, and runtime behavior over time. Used together, they give SQL Server and Azure SQL teams a practical baseline for tuning and regression analysis.
Why native tooling still matters
The main advantage is engine integration. Microsoft's documentation says Query Store captures query execution plans and runtime statistics over time, and you can compare behavior before and after index changes or code deployments Microsoft Query Store documentation. That makes it a strong choice for regression work because the evidence comes from the engine itself, not from an agent trying to reconstruct what happened later.
The other practical benefit is that Query Store fits the tuning workflow. DBAs can inspect estimated, actual, and live query statistics, review plan history, and decide whether a plan change is safe before forcing it. In a busy SQL Server estate, that matters more than a generic optimization score, because the team needs to know which plan changed, why it changed, and whether the fix is better under production load.
Where DTA still earns a place
DTA is older, but it still has a use in controlled tuning sessions. It can test workload-driven index and partitioning ideas without requiring a separate third-party platform, which is useful when a team wants to stay inside Microsoft tooling or does not yet have a more advanced profiler in place. The trade-off is that its recommendations depend heavily on the workload you feed it, so the output is only as good as the capture window and the assumptions behind it.
That makes it better for deliberate analysis than for constant background monitoring. In practice, I use DTA when I want to evaluate a specific workload replay or validate whether a structural index change is worth testing, then I use Query Store to watch how the engine behaves after the change ships. If your team is exploring AI-assisted SQL analysis on top of the native workflow, Querio's SQL Server query analysis approach is a separate layer, not a replacement for the engine tools.
The trade-offs
The downside is that native tools still require discipline. Query Store can become noisy if teams do not agree on retention, capture settings, or how plan forcing should be governed. DTA also reflects the workload you give it, so a short or unrepresentative trace can lead to index advice that looks good on paper but does not hold up under production concurrency.
For SQL Server and Azure SQL teams, that is the decision point. If you already have the native tools configured and your team knows how to interpret plans, Query Store and DTA can cover a lot of day-to-day tuning work without buying anything else. If you need cross-database observability, shared dashboards, or a broader platform for a mixed estate, they are only part of the stack.
6. Microsoft SQL Server Database Tuning Advisor (DTA) + Query Store
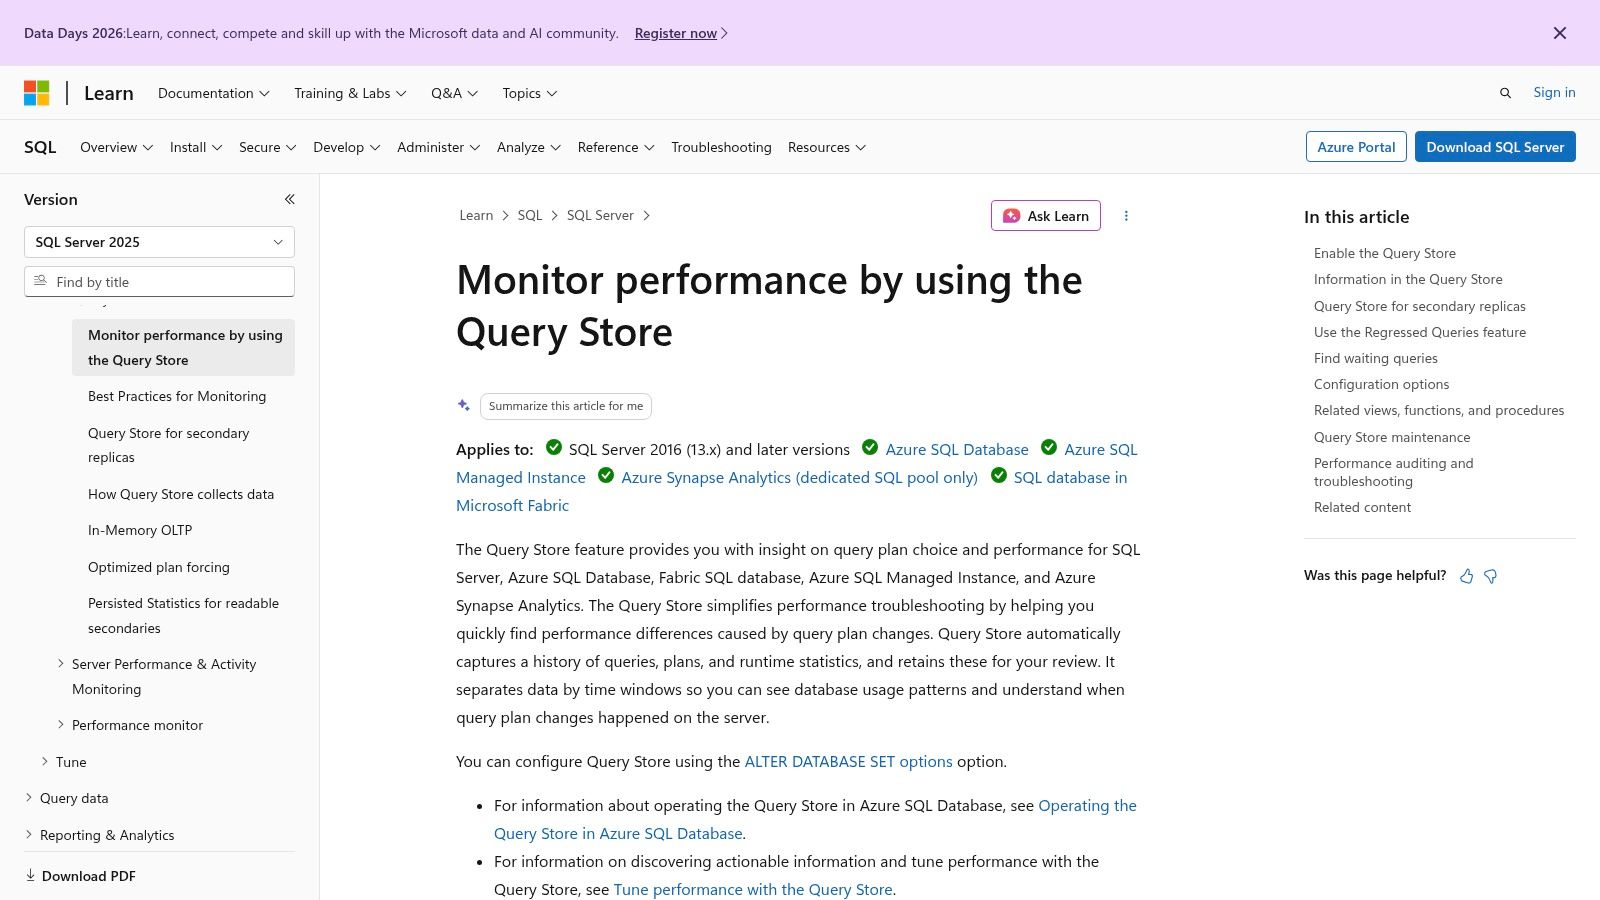
SQL Server teams often already have two powerful tools sitting in the box, and they don't always use them well. Database Tuning Advisor recommends indexes, indexed views, and partitioning based on a workload, while Query Store captures query texts, plans, and performance over time, and supports regression diagnosis and plan forcing. Together, they form the native tuning baseline for SQL Server and Azure SQL.
Why native tooling still matters
The main advantage is engine integration. Microsoft's documentation says Query Store captures query execution plans and runtime statistics over time, and you can compare performance before and after index changes or code deployments Microsoft Query Store documentation. That makes it highly reliable for diagnosing regressions because the evidence comes from the engine itself, not from an agent trying to reconstruct what happened later.
Microsoft's training also highlights the practical workflow around estimated, actual, and live query statistics, plus plan history and runtime behavior Query Store training material. For SQL Server DBAs, that means less guessing and more measured comparison. It also lines up with the long-standing cost-based model where statistics quality shapes plan quality, which is why plan inspection and refreshed statistics remain part of standard optimization practice Microsoft Research tutorial on query optimization.
Where it gets tricky
The limitation is obvious, it only helps inside the Microsoft SQL family. Recommendations also need human review, because no tuner can understand every business constraint or concurrency pattern. A suggested index can help one query and hurt write performance elsewhere, so validation is still part of the job.
Operational habit: turn on Query Store before you need it, because retrospective tuning without history is much harder.
Teams wanting a broader explanation of SQL Server tuning with AI assistance can also look at query SQL Server with AI, which fits naturally alongside the native stack.
7. Oracle SQL Tuning Advisor (with Oracle Tuning Pack)
Oracle's SQL Tuning Advisor is the native choice when you want engine-aware recommendations inside the Oracle ecosystem. It analyzes problematic SQL and can suggest SQL Profiles, statistics fixes, and index changes, which makes it one of the most direct ways to tune without leaving Oracle's tooling surface. If your team already relies on Performance Hub or Enterprise Manager, the advisor slots into that workflow cleanly.
What Oracle gives you natively
The appeal is not mystery, it's context. Oracle knows its own execution environment, so the recommendations are informed by the same engine behavior that generates the plan. That is exactly what you want when the problem involves complex SQL, because hand-waving over a plan often misses the underlying issue. Oracle's own documentation frames it as an analysis and recommendation workflow rather than a blind rewrite engine.
The tool also reduces trial-and-error. In a busy production environment, fewer experimental changes usually means fewer surprises. That matters in Oracle shops where a misstep can become a long change-management cycle.
Licensing and access are the trade-offs
The main issue is cost and access. The Tuning Pack is an additional license, so adoption depends on whether the organization already owns it or can justify the purchase. Privileges and edition requirements also matter, which means the tool is not universally available to every Oracle user by default.
For teams that live in Oracle all day, the native advisor is often the most defensible first stop. For everyone else, the licensing and ecosystem lock-in make it hard to recommend as a general-purpose optimizer.
8. Snowflake Query Profile + Query Acceleration Service (QAS)
Snowflake's own tooling is the correct starting point if your workload already lives in Snowflake. Query Profile gives you a visual execution trace with operator-level statistics, and Query Acceleration Service adds a serverless path to speed up expensive scans by dynamically allocating extra compute. That combination is attractive because it doesn't require a separate observability stack just to understand what the warehouse is doing.
Why warehouse-native profiling is different
Warehouses are not row-store OLTP systems, so the tuning logic changes. Query Profile helps you see operator behavior directly inside Snowflake, which is useful when a query is slow because it scans too much, spills somewhere unexpected, or fans out badly across execution steps. That visibility is a better fit than generic SQL advice, because warehouse bottlenecks are often shaped by compute allocation and scan patterns, not just join order.
QAS adds a different kind of relief. Instead of resizing the warehouse every time a heavy workload hits, Snowflake can allocate extra compute dynamically for supported cases. That makes it a practical option for teams that need lower latency for complex scans without permanently paying for a larger warehouse shape.
The cost conversation still matters
The trade-off is that QAS is a paid serverless feature, and costs depend on credit consumption. Snowflake does provide cost transparency through its billing and credit usage tools, but teams still need to track usage carefully, especially if multiple analysts and BI tools are competing for the same warehouse. In other words, the feature can reduce latency, but it won't remove the need for governance.
For teams building natural-language access on top of Snowflake, the guide on how to query Snowflake with AI natural language to SQL is a useful complement.
9. Percona Monitoring and Management (PMM) with Query Analytics (QAN)
PMM is the open-source answer for teams that want observability without a license line item. Its Query Analytics view is built to surface slow queries, workload rankings, and execution metrics across MySQL, PostgreSQL, and MongoDB, which makes it a solid fit for teams standardizing on open source and willing to run the platform themselves. That self-hosted model is the key trade-off, and for the right team, it's a good one.
Strong fit for open-source stacks
The practical benefit is control. You host it, you maintain it, and you keep your telemetry in your own environment. That matters for teams with compliance concerns or teams that prefer to avoid SaaS dependency for core performance data. PMM also gives you real-time and historical dashboards, so it's useful for both incident response and trend analysis.
It's especially appealing when you have multiple open-source engines and want a common monitoring vocabulary. Query ranking by load helps focus engineers on what matters most instead of spending time on the queries that are noisy but cheap. In day-to-day operations, that distinction saves time.
What you give up
The price of open source is operational overhead. Someone has to host PMM, keep it healthy, and make sure the metrics pipeline stays reliable. The other limitation is automation depth, because PMM is stronger at visibility than at rewriting or applying deep remediation on your behalf. That's not a flaw, just a different job.
Good rule for PMM: use it when your team can own the platform and wants transparent, cross-engine observability more than automated tuning.
10. Datadog Database Monitoring (DBM)
Datadog DBM makes sense when the database is only one part of a larger observability picture. It offers query-level analytics, explain plans, normalized query grouping, obfuscation for sensitive data, and correlation with infrastructure and APM metrics. For teams that already run Datadog, that unified view can be more useful than a database-specific point tool.
Why it fits app-first organizations
The best thing about DBM is cross-team visibility. If an application deploy, an infrastructure change, and a query regression happen together, Datadog gives you one place to compare them. That's a real advantage for product engineering teams that need to connect user-facing latency to backend behavior without jumping between tools.
Its broad engine coverage also helps. The platform supports major relational and non-relational databases, which makes it suitable for organizations that grew beyond a single database standard. Normalized query grouping is particularly valuable in noisy environments because it reduces duplicate-looking statements into something people can reason about.
What to watch before buying
The pricing and product structure need planning. DBM is sold as part of Datadog's broader monitoring ecosystem, so you need to already be a customer in that stack. Per-host pricing and query quotas also matter at scale, especially if many instances or high-cardinality workloads are involved.
That makes DBM a strong fit for centralized observability teams and a weaker fit for buyers who only need a database tuner. If your goal is one pane of glass across apps and databases, it works well. If your goal is a cheaper specialist optimizer, it's probably more than you need.
Top 10 Query Optimization Tools, Feature Comparison
Tool | Supported DBs | Key features | Target audience | Unique selling point | Pricing & deployment |
|---|---|---|---|---|---|
EverSQL (Aiven) | MySQL, PostgreSQL | Auto SQL rewrites; index recommendations; upload EXPLAIN; optional slow-query sensor | Developers/teams without deep DBA capacity | Fast, non-intrusive ad-hoc optimization; free entry via Aiven | SaaS via Aiven; free entry path; recommendations require validation |
pganalyze | PostgreSQL | Workload-aware Index & Query Advisor; plan capture/visualization; health checks | Postgres DBAs and infra teams | Deep, actionable Postgres-specific guidance; enterprise/self-hosted options | Tiered pricing; self-hosted Enterprise available; costs scale with servers |
pgMustard | PostgreSQL (9.6–18) | EXPLAIN/ANALYZE scoring; per-op timings; ranked impact tips | Devs/DBAs triaging slow queries | Lightweight, fast triage with clear next steps | SaaS/API; free trial (up to 5 plans); lightweight adoption |
SolarWinds DPA | Multi: SQL Server, Oracle, MySQL, Postgres, Db2, SAP ASE, cloud | Wait-time analysis; real-time & historical views; root-cause isolation | Large enterprises with mixed DB estates | Enterprise-grade cross-platform performance analytics | Licensed (quote); heavier deployment & ops overhead |
Quest Toad SQL Optimizer | Oracle (also SQL Server editions) | Automated SQL rewriter; generates/tests query variants; plan comparisons | Oracle developers using Toad IDE | IDE-integrated optimization that accelerates dev tuning loop | Part of Toad bundles; license quote; desktop/enterprise editions |
MS SQL DTA + Query Store | SQL Server, Azure SQL | Automated index/partition recommendations; plan history & forcing; regression diagnostics | SQL Server DBAs and developers | Native engine integration; included with SQL Server/Azure | Included with SQL Server/Azure SQL; no extra license but needs review |
Oracle SQL Tuning Advisor | Oracle DB | SQL Profiles; stats fixes; index suggestions; Enterprise Manager integration | Oracle DBAs/enterprise customers | High-quality native tuning inside Oracle ecosystem | Requires Oracle Tuning Pack license (additional cost) |
Snowflake Query Profile + QAS | Snowflake only | Operator-level query profiling; serverless Query Acceleration Service (QAS) | Snowflake users/analytics teams | First‑party profiling + serverless acceleration for heavy scans | Built-in profiling; QAS is paid (credits); no extra deployment |
Percona PMM (QAN) | MySQL, PostgreSQL, MongoDB | Query Analytics; real-time & historical dashboards; advisor checks | Teams preferring open-source, self-hosted observability | Open-source, no license fees; multi-DB self-hosted platform | Free OSS; requires hosting and operational maintenance |
Datadog DBM | Multi: Postgres, MySQL, SQL Server, Oracle, MongoDB, ClickHouse, etc. | Slow-query detection; explain plans; normalized grouping; PII obfuscation; infra correlation | Organizations using Datadog observability | Unified app+infra+DB visibility within Datadog | SaaS add-on; per-host pricing; requires Datadog Infrastructure subscription |
How to Choose Your Tool and Look Beyond Tuning
Choosing the right tool starts with your database, not the marketing page. PostgreSQL teams usually get the best results from purpose-built tools like pganalyze or pgMustard, especially when the need is plan review, workload correlation, or fast triage. SQL Server teams should begin with native tooling, especially Query Store and Database Tuning Advisor, because Microsoft's own guidance makes clear that the engine's statistics and captured runtime history are central to high-quality plans and regression analysis Microsoft Research query optimization tutorial, Microsoft Query Store documentation. Snowflake users should stay native first, since Query Profile and QAS are built for that execution model.
Team maturity matters just as much. If you have one DBA and a few engineers, a guided tool like EverSQL or pgMustard can move a specific query quickly. If you support many services and need recurring visibility, a monitoring platform like PMM, DPA, or Datadog DBM will save more time than a rewrite assistant because it catches regressions before they turn into tickets. That aligns with the broader shift in the market, where database optimization tools are increasingly tied to query execution analysis, workload concurrency, observability, and AI-assisted remediation rather than one-time SQL cleanup database optimization tool market scope.
Budget and operating model should decide the rest. Oracle Tuning Pack and enterprise monitoring suites make sense when the environment is already standardized and the cost is easy to justify. Open-source and native tools fit teams that want control and can invest the time to run them well. AI-assisted query optimization is also moving into the mainstream, with one market projection placing the category at $3.2 billion in 2025 and $17.8 billion by 2034, a sign that buyers want more automated guidance in production workflows Query Optimization AI market projection.
There's also a bigger strategic point. Faster queries help, but reducing the number of repetitive queries helps more. Querio approaches that problem by putting AI coding agents on your warehouse so non-technical users can self-serve analysis without waiting on the data team. If you want to cut optimization work at the source and give people faster access to answers, Querio is worth a serious look.

