Self Serve BI: A Startup's Guide to Real Data Autonomy
Unlock true data autonomy. Our guide to self serve BI covers architecture, governance, and avoiding the 'false autonomy' trap for faster, smarter decisions.
published
Outrank AI
self serve bi, business intelligence, data analytics, data democratization, startup analytics
b5113311-dbbc-480a-a638-2ba38af46e2f

The most popular advice about self serve BI is also the reason so many rollouts fail: buy a modern tool, connect the warehouse, give teams dashboard access, and let the bottleneck disappear.
It doesn't work like that.
What most companies create is false autonomy. People get charts, filters, and a polished interface, but they still can't answer the questions that matter when the logic gets messy, the metric definitions are unclear, or the next analytical step isn't obvious. The data team still gets pulled in. It just gets pulled in later, after confusion has already spread.
I've seen the pattern enough times to treat it as a design flaw, not a training issue. If your product managers can slice activation by plan tier but can't explain why a cohort changed, or your executives can open a dashboard but still ask analysts for every follow-up, you don't have self service. You have a nicer ticketing system.
Table of Contents
The Self Serve BI Promise and Its Perils
Self serve BI is not hype, but the hype has outpaced the implementation discipline required to make it work.
The category is expanding because the underlying need is real. The global self-service BI market is valued at USD 10.56 billion in 2024 and projected to reach USD 40.19 billion by 2034, growing at a 14.3% CAGR, according to Straits Research's self-service BI market analysis. Companies are moving away from older, centralized reporting models because waiting on analysts for every question doesn't scale.
That part is true.
The part vendors usually skip is that access alone doesn't create analytical capability. A dashboard library doesn't teach a PM which metric is trustworthy. A drag and drop report builder doesn't resolve conflicting business logic. A natural language box doesn't remove the need for context, definitions, and judgment.
Why the promise breaks
The failure mode is easy to recognize:
Business teams get interfaces, not understanding.
Analysts stop building simple exports, but inherit harder cleanup work.
Leadership thinks the problem is solved because usage logs look healthy at first.
Complex questions still route back to the data team.
In startups, this problem gets worse because metrics evolve fast. Pricing changes. Event tracking changes. Product definitions change. Teams are trying to move quickly, and self serve BI gets treated like a software purchase instead of an operating model.
Practical rule: If your team can't explain how a number is defined, they shouldn't be self-serving it yet.
What true autonomy looks like
Done well, self serve BI changes the job of the data team. Instead of acting like a human API, the team builds a reliable analytics environment where common decisions can happen without intervention. Product managers explore feature adoption on their own. Revenue leaders inspect pipeline movements without waiting for a one-off report. Finance can answer routine questions from governed datasets instead of reconciling spreadsheet versions all week.
The difference is simple. Good self serve BI doesn't remove the data team. It moves the data team up the stack.
Defining True Self Service Business Intelligence
Traditional BI is like a restaurant with a fixed menu. Analysts decide what's available, prepare every dish, and hand it over when requested. Business users can consume the output, but they can't change much without going back to the kitchen.
True self service BI is closer to a professionally organized kitchen. The ingredients are clean. The stations are labeled. The knives are sharp. Safety rules are in place. Individuals still won't invent fine dining from scratch, but they can make what they need without asking the head chef to plate every meal.
A better definition
At a practical level, self serve BI means non-technical users can answer a meaningful set of business questions on their own from governed data.
That requires more than a BI front end. It needs:
Accessible data: business-ready tables, not raw warehouse sprawl.
A usable query layer: people should be able to filter, compare, drill, and explore without writing SQL for routine work.
Flexible outputs: dashboards, ad hoc views, cohort cuts, and visualizations that support actual decisions.
Shared definitions: one place to understand what “active user,” “qualified pipeline,” or “retained customer” means.
The need for this is structural, not cosmetic. The world generated 64.2 zettabytes of data in 2020 and is projected to reach 181 zettabytes by 2025, according to Data Bridge Market Research on the self-service BI market. That volume doesn't just create reporting demand. It creates interpretation risk. More data without a usable model gives teams more ways to be wrong.
If you're sorting out where analytics ownership should sit, this guide to self-service analytics benefits, risks, and governance is a useful companion because it separates access from accountability.
Three models of business intelligence
Attribute | Traditional BI | False Autonomy BI | True Self-Serve BI |
|---|---|---|---|
Data access | Centralized through analysts | Broad, but often confusing | Broad and curated |
Metric definitions | Usually controlled by BI team | Inconsistent across dashboards | Standardized and documented |
User experience | Static reports and tickets | Editable dashboards with limited depth | Guided exploration with clear logic |
Common outcome | Slow turnaround | Early excitement, then fallback to analysts | Faster routine decisions |
Analyst role | Report producer | Cleanup and escalation layer | Model builder, governor, enabler |
Trust level | High but slow | Mixed | High enough for everyday use |
A team isn't self-sufficient because it can click filters. It's self-sufficient when it can ask a valid question, use trusted data, and interpret the result correctly.
False autonomy usually appears mature from the outside. There are dashboards. There are licenses. There may even be lots of usage in the first few weeks. But when the first serious question arrives, everyone learns whether the system was designed for exploration or only for consumption.
The Benefits and Inevitable Tradeoffs
The strongest case for self serve BI isn't that it makes data look modern. It's that it changes the speed and quality of routine decision-making across the company.
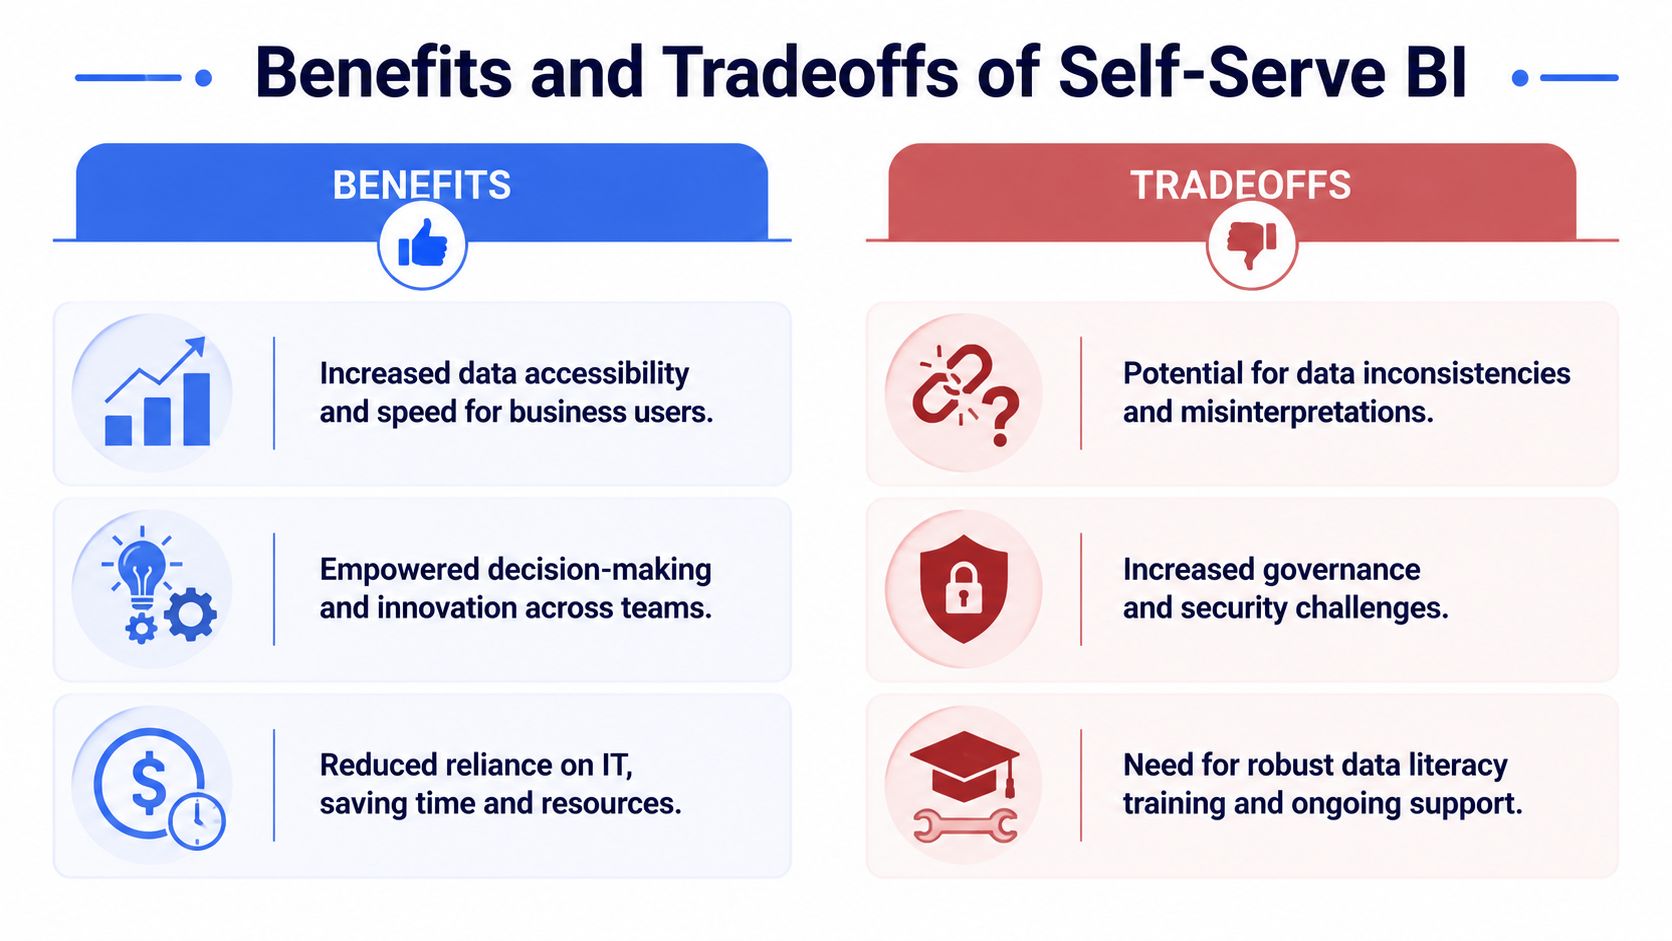
Self-service BI improves decision speed because business users can modify reports and produce visualizations without submitting support tickets, which removes the time-to-insight bottleneck and lets IT focus on higher-value work such as modeling user-friendly data marts, as described by BARC's overview of self-service BI.
What teams gain
When the rollout is done well, the gains are immediate in the places that matter most.
Faster operating decisions: PMs don't need to wait in queue to review feature adoption, segment behavior, or funnel movement.
Better use of analysts: Data teams spend less time exporting CSVs and more time improving models, definitions, and experimentation support.
More local ownership: Teams closest to the business question can inspect the data themselves instead of translating the problem through several layers.
This is also where adjacent tooling matters. Teams often pair BI with AI-assisted analysis, especially when users need help framing statistical questions. A practical roundup of the best AI for statistical tasks is useful if you're deciding where BI ends and deeper analysis support begins.
What gets harder
The tradeoffs are real, and ignoring them is how programs stall.
First, misinterpretation risk rises when more people can query data without enough context. A wrong chart built quickly is still wrong.
Second, governance work moves earlier. You can't bolt trust on after launch. Permission models, metric ownership, naming conventions, and certification need to be in place before broad rollout.
Third, training has to go beyond software tutorials. Users don't just need to know where the filter button is. They need to understand grain, cohort logic, lagging metrics, and when a dashboard can't answer the question they've asked.
The cost of self serve BI isn't the tool. It's the discipline required to keep answers consistent after access expands.
That's the trade. You reduce the queue for routine questions, but only if you invest in the systems that prevent routine confusion.
Designing a Modern Self Serve BI Architecture
Most self serve BI problems that show up as “adoption issues” are really architecture issues.
If the warehouse is messy, the semantic layer is missing, or the access model is loose, users will feel that as friction. They won't describe it that way. They'll say the tool is confusing, the numbers don't match, or the dashboard doesn't answer the question. They're usually right.
The layers that matter
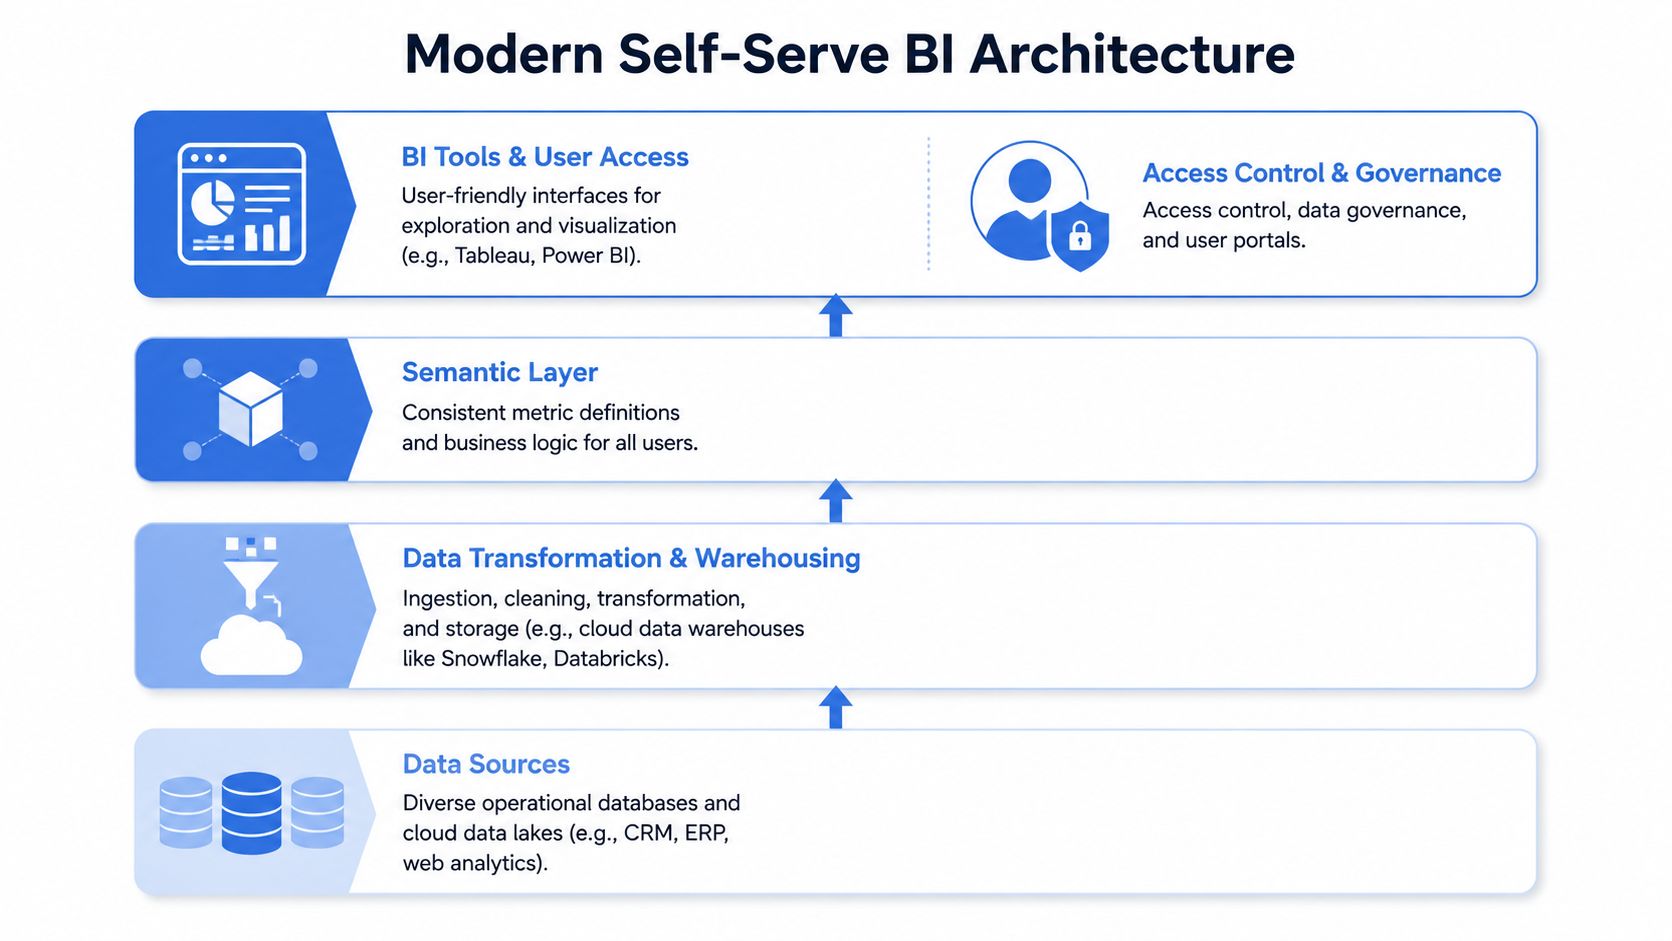
A modern setup usually has four parts.
Source systems and event streams
CRM, billing, product analytics, support tooling, and application databases feed the core environment. Startups often underestimate how much semantic conflict begins here.Transformation and storage
Teams clean, join, and standardize data in platforms like Snowflake, BigQuery, or Databricks. If this layer is weak, every BI tool on top becomes an expensive interface for raw confusion.Semantic layer This is the backbone of self serve BI. It defines business logic once, so “active account” doesn't mean one thing in sales and another in product.
Consumption layer
Tableau, Power BI, Looker-style interfaces, notebook workflows, and search-driven analytics all sit here. Different teams need different experiences. A fixed dashboard works for recurring reviews. Product analysts often need more exploratory surfaces.
For support and operations teams, it's useful to study examples of how teams combine AI and BI for service workflows, such as this piece on a Halo AI platform for support insights. It highlights an important architectural point: the insight layer has to reflect the decision workflow, not just the data model.
Governance has to live inside the stack
Security isn't a procurement checkbox. It's part of the product design of self serve BI.
A critical requirement for adoption is enterprise-grade security including SSO, encryption, and audit logs, because those controls maintain governance while still letting users explore live data in real time, according to Reveal BI's guidance on self-service BI. If your access controls are sloppy, self service becomes a trust problem. If they're too rigid, people export data and rebuild analysis outside the system.
That's why agile startups increasingly prefer architectures that separate governed data logic from the interaction layer. Some teams want traditional dashboards. Others need notebook-like workflows that let technical and non-technical users collaborate in the same environment. A good reference point is this overview of the modern self-service BI stack, especially if you're choosing between rigid dashboard-first tools and more flexible analysis surfaces.
One practical option in that second category is Querio, which uses AI coding agents on top of the warehouse and a file-system-style notebook workflow so teams can query and build on governed company data without forcing every task into a static dashboard format.
Your Roadmap for Successful Implementation
Most companies try to launch self serve BI broadly and then wonder why nobody trusts it. The better path is narrower. Start with one decision area where the pain is visible, the stakeholders care, and the logic can be made stable enough to support repeat use.

A phased rollout that works
A rollout that holds up under pressure usually follows a pattern like this:
Start with one operational use case.
Product engagement, support performance, or pipeline inspection are good candidates. Avoid a company-wide KPI portal as your first move. It sounds strategic and usually turns into a fight over definitions.
Build the governed layer before the interface spreads.
Get metric definitions, ownership, and access rules in place first. If users see contradictory numbers during the pilot, trust drops fast and is hard to recover.
Train users on thinking, not clicking.
Teach people how to interpret a cohort, what a denominator change does, and when an apparent trend is only a tracking artifact. Tool training matters, but analytical judgment matters more.
Expand by team, not by license count.
Scale with real workflows. Product may need exploratory analysis. Sales leadership may need certified dashboards. Finance may want reconciled exports. Treat these as different use cases, not one audience.
A realistic startup example
At a SaaS startup, the cleanest pilot is often product analytics because the need is frequent and the users are close to the questions. The pattern that works looks like this:
Month one and two: align on the few product metrics that guide decisions. Cut everything else.
Next: publish curated tables and a short metric glossary. Keep it boring and explicit.
Then: run live working sessions with PMs using their own questions, not canned examples.
After trust forms: let teams build their own views within guardrails, and route ambiguous logic back to the data owner quickly.
If a pilot doesn't change a weekly operating meeting, it isn't a real pilot. It's a demo.
The teams that succeed don't “finish implementation.” They build a habit. Every rollout phase should tighten the loop between a business question, a trusted dataset, and a decision someone is responsible for making.
Common Pitfalls and How to Avoid Them
The most common self serve BI failures aren't technical edge cases. They're predictable mistakes that show up when companies confuse software access with analytical enablement.
The traps that break adoption
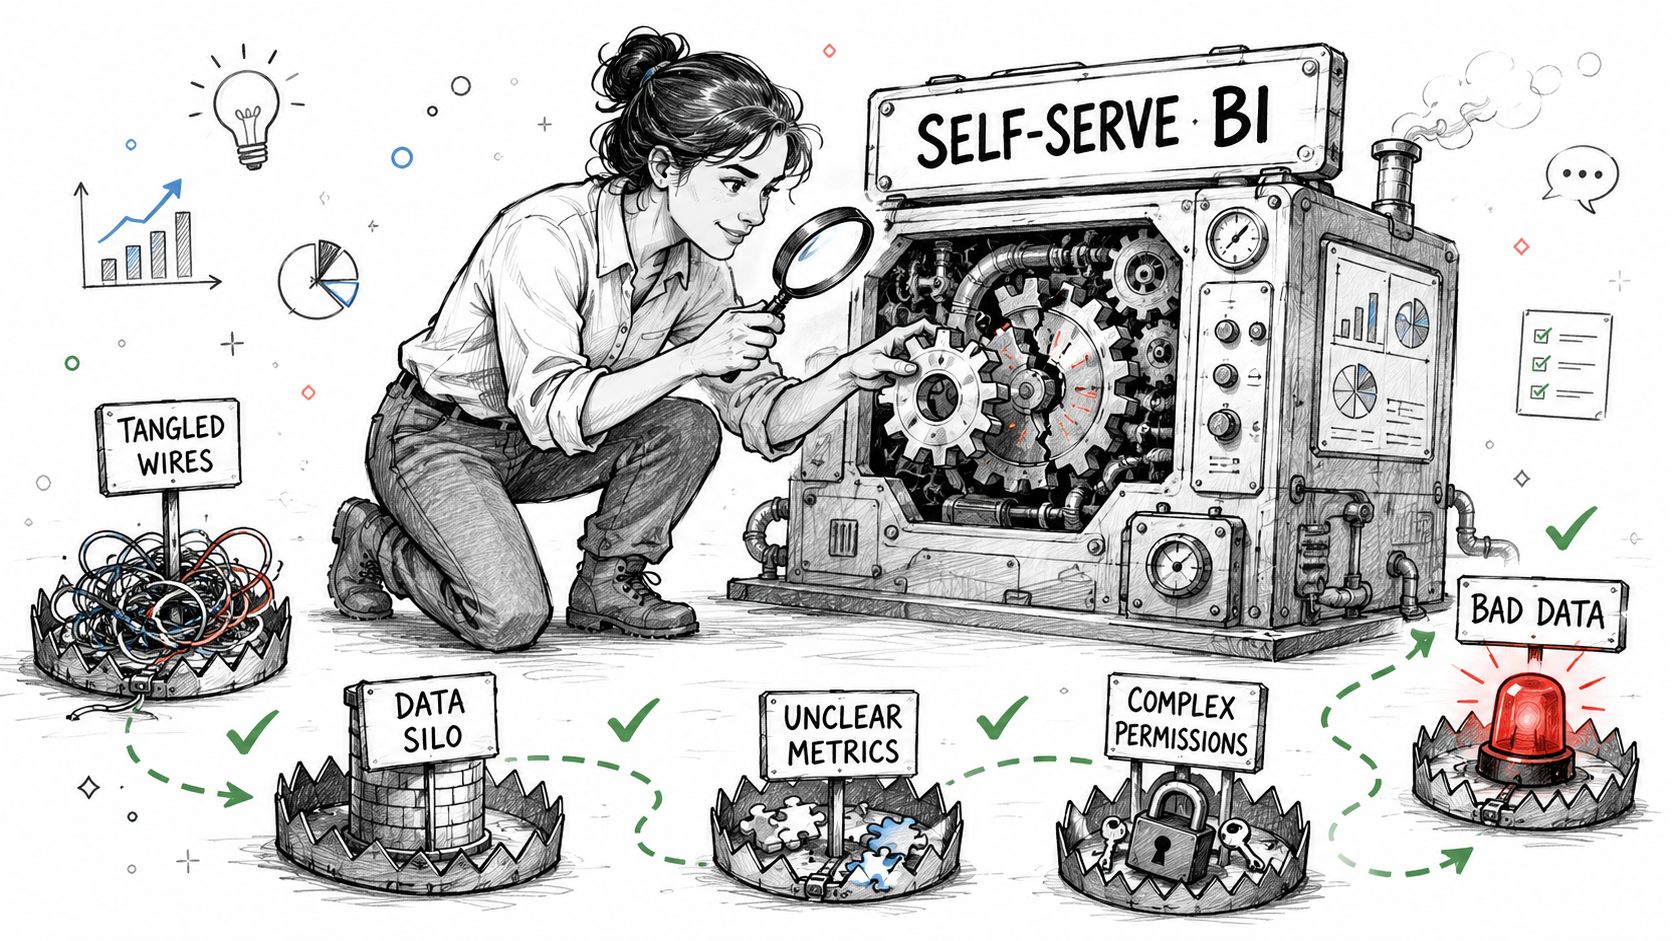
The biggest one is the false autonomy gap. Users can do simple queries but get stuck on complex analysis without SQL knowledge or enough context. In the Reddit discussion on whether usable self-serve BI really exists, data engineers described how these tools work for simple tasks but break down on more complex work, and that same discussion cites data suggesting 60% of self-serve initiatives revert to analyst dependency within 12 months because of this gap, as noted in the Reddit data engineering thread on self-serve BI limitations.
That problem usually travels with a few others:
Metric sprawl: multiple dashboards define the same KPI differently.
Tool rigidity: the platform handles polished dashboards well but falls apart when users need exploratory analysis.
Weak ownership: nobody is clearly responsible for a metric once it's live.
Culture mismatch: leaders still ask for offline exports, so teams learn that the BI layer isn't the primary decision system.
A lot of dashboard pain comes from design choices that look harmless at launch. This guide to avoiding pitfalls in BI dashboards is useful because it focuses on the trust and usability failures that subtly drive people back to spreadsheets or analyst requests.
How to keep the system trustworthy
The fix is not “more training” in the abstract. It is targeted enablement plus tighter system boundaries.
Create escalation paths for questions that exceed the tool's intended use. Certify the small set of metrics that matter most. Remove duplicate dashboards aggressively. Don't reward teams for building lots of content. Reward them for using a shared model and making decisions faster with fewer clarification loops.
Good self serve BI has edges. Users should know what they can do alone, what needs review, and where to go when the question changes shape.
The programs that hold up aren't the ones that promise unlimited self-service. They're the ones that make reliable self-service normal.
Measuring Success and Evolving Your Strategy
If you only measure success by dashboard views, you'll get a flattering story and a weak system.
The better test is behavioral. Are teams making routine decisions inside the governed environment? Are analyst queues shrinking for repeatable questions? Are weekly business reviews using shared metrics instead of side spreadsheets? Those are the signs that self serve BI is becoming infrastructure instead of presentation.
Track a mix of operational and qualitative indicators:
Adoption by role: who uses the system regularly, and who still routes around it
Request deflection: which ad hoc questions no longer land in the analyst queue
Decision-cycle quality: whether teams can move from question to answer in the flow of work
Metric trust: whether stakeholders accept the number without opening a reconciliation debate
Coverage gaps: where people still need analyst intervention because the model or tooling stops short
In marketing and growth contexts, examples of solving scattered marketing data with a dashboard can be useful because they show how fragmented reporting creates operational drag long before anyone labels it a BI problem.
For teams that want a more formal scorecard, this framework for measuring ROI and key metrics in AI BI is a practical way to connect adoption, trust, and workflow impact.
A mature self serve BI strategy keeps evolving. New teams join, metric definitions tighten, and some use cases outgrow dashboards and need deeper analytical surfaces. That's normal. The point isn't to eliminate the data team from the loop. It's to reserve the data team's time for the problems that require their expertise.
If your team is stuck in the gap between dashboard access and real analytical autonomy, Querio is worth a look. It gives teams a governed way to query and build on warehouse data with AI-assisted workflows, which can help reduce analyst bottlenecks without forcing every question into a rigid BI interface.


