Best Anomaly Detection Tools: Expert Guide 2026
Find the best anomaly detection tools for your team. This guide covers key approaches, selection criteria, & how to operationalize detection effectively.
https://www.youtube.com/watch?v=OS9xRGKfx4E
published
Outrank AI
anomaly detection tools, data monitoring, machine learning tools, time-series analysis, data observability
d1a37e5b-449f-45e7-830f-57299e06b15a

Your product dashboard still looks healthy. Revenue hasn't collapsed. Signups haven't fallen off a cliff. But one engagement metric has drifted in the wrong direction for days, support volume is creeping up, and nobody can say whether this is noise, seasonality, or the start of a real issue.
That's where many organizations get stuck. Basic monitoring catches the obvious failures. It doesn't catch the subtle behavior changes that matter to product leaders, finance teams, and operators. A threshold alert can tell you when something is already broken. It usually won't tell you when the system has started behaving differently.
That gap is why anomaly detection tools matter. Used well, they act as an operational layer on top of your data stack. Used poorly, they become another source of false alarms, brittle pipelines, and analyst cleanup work. The hard part isn't choosing the fanciest algorithm. It's choosing a tool that fits your data architecture, your team's workflow, and your tolerance for maintenance.
Table of Contents
Beyond the Dashboard When Metrics Go Sideways
A common failure pattern looks boring at first. A mobile app keeps shipping features, acquisition is stable, and weekly active users don't trigger any red alerts. Then retention starts sliding in one segment, session depth softens in another, and a release that seemed harmless turns out to have changed user behavior in a way nobody notices until the quarterly review.
That's the practical difference between dashboarding and anomaly detection. Dashboards help teams inspect known metrics. Anomaly detection tools help teams surface unknown changes in behavior that don't map neatly to a fixed threshold.
For product leaders, this matters because most business damage doesn't begin with a dramatic outage. It begins with a pattern that looks explainable enough to ignore. A campaign underperforms in one region. Checkout latency rises only for a subset of devices. A pricing test shifts conversion mix without tanking top-line revenue. Those are operational signals, not just reporting artifacts.
Basic monitoring answers, “Did a number cross a line?” Anomaly detection answers, “Is this pattern still normal?”
IBM describes anomaly detection as identifying observations, events, or data points that deviate from what's usual or expected, and notes its use across industries as a broad analytics discipline rather than a niche technique in IBM's overview of anomaly detection. In practice, that's why many teams are connecting anomaly workflows directly to BI and operational review, not treating them as a side project. A useful example is this look at how AI powers anomaly detection in BI dashboards, which shows why passive reporting isn't enough once the business starts moving faster.
The mistake I see most often is buying anomaly detection tools as if they're just smarter alerts. They're not. They're part of your operating model. If they can't fit your warehouse, your event streams, your incident workflow, and your team's capacity to maintain them, they won't stay in use.
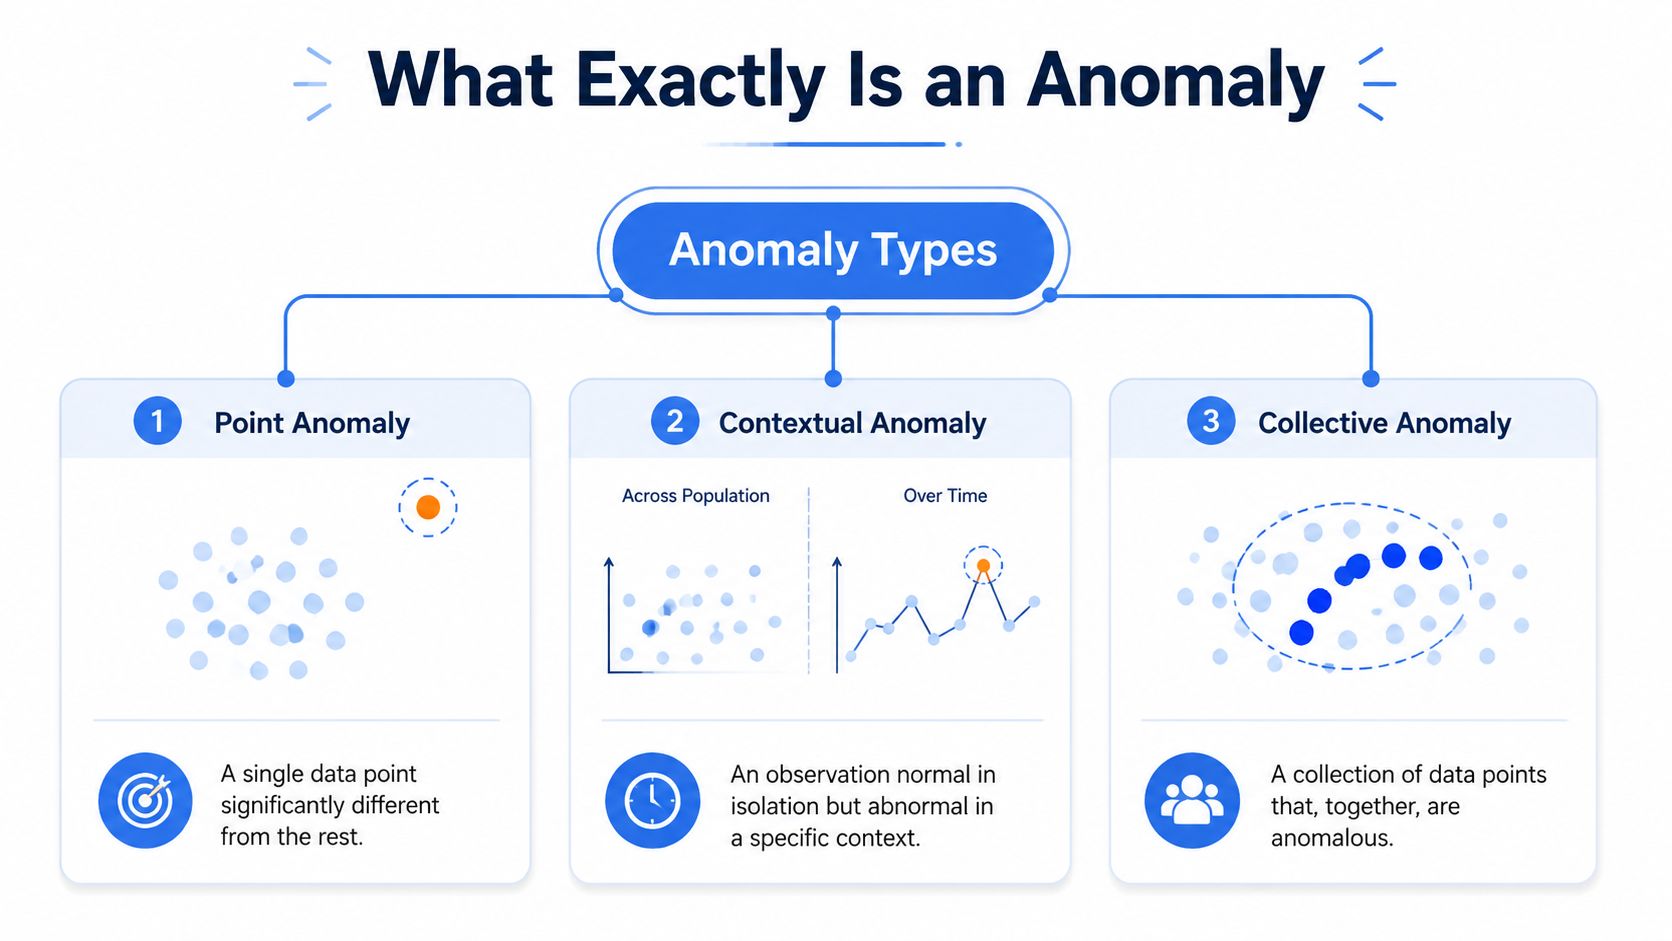
What Exactly Is an Anomaly
A team sees checkout conversion dip 3 percent and asks for anomaly detection. That request is still too vague to buy a tool, wire alerts, or assign ownership. The practical question is narrower. What kind of abnormal behavior matters enough to investigate, and in what operating context will you detect it?
An anomaly is any observation or pattern that falls outside expected behavior for the business process you are monitoring. That sounds simple until a team has to encode “expected.” Expected for which customer segment, which hour, which release version, and which data pipeline latency? Those choices determine whether you need a lightweight batch check in the warehouse, a streaming detector on event data, or both. They also determine cost. Real-time coverage usually means more integration work, more tuning, and more human review than teams expect.
Point anomalies
A point anomaly is a single value that is clearly out of range.
Examples include one payment that is unusually large, one sensor reading that jumps far above normal, or one minute of API latency that breaks sharply from recent history. These are the easiest anomalies to explain and usually the cheapest to detect. A threshold, percentile band, or simple statistical model is often enough, especially for stable metrics reviewed in batch.
That does not make them trivial. Point anomaly tools tend to look good in demos because isolated spikes are easy to visualize. In production, they can create alert noise if the metric is naturally volatile or if upstream data quality is inconsistent.
Contextual anomalies
A contextual anomaly looks acceptable on its own and wrong once you add time, segment, or operating conditions.
Traffic at 20,000 sessions may be normal during a campaign launch and suspicious at 2 a.m. Conversion in one country may look fine in aggregate but break from its usual weekday pattern after a pricing change. Product teams run into this constantly because user behavior is shaped by seasonality, geography, devices, release cycles, and promotions. A detector that ignores context will miss real issues and flag harmless variance.
This is why a solid grasp of time series analysis for trend and seasonality matters before vendor evaluation. If your baseline shifts throughout the day or week, a tool that only compares against a global average will waste analyst time.
Collective anomalies
A collective anomaly appears when a set of normal-looking points forms an abnormal sequence or cluster.
This is often the category with the highest business value. A few small latency increases across related services can signal an upstream dependency problem before any single metric crosses a threshold. A string of modest conversion drops across several onboarding steps can point to a broken release. In industrial settings, vibration, temperature, and pressure may each stay within tolerance while their combined pattern indicates equipment risk, which is why predictive maintenance teams often rely on sequence-level detection and domain review. For a practical example from that world, this technical guide for reliability engineers shows how anomaly detection ties to maintenance decisions rather than isolated outliers.
A useful rule is simple. Define the anomaly in business terms before you evaluate the tool.
Teams that need to catch pattern shifts across sessions, devices, or services often buy products optimized for single-point outliers because the setup looks faster. The result is predictable. Low trust, too many false positives, and expensive manual triage. The right definition upfront saves more money than a more advanced model added later.
Statistical Machine Learning and Deep Learning Approaches
Most anomaly detection tools package algorithms behind a clean interface, but the underlying approach still affects setup effort, accuracy, explainability, and maintenance. If you don't understand the trade-offs, vendor demos all start to sound the same.
MindBridge summarizes the historical shift clearly. Older methods like Z-score, interquartile range, and Grubbs' test work well on smaller datasets with stronger assumptions about distribution, while modern tools increasingly use AI and unsupervised machine learning because manual inspection doesn't scale and current systems need to combine history with real-time monitoring, as explained in MindBridge's review of anomaly detection techniques.
Statistical methods
Statistical approaches are the rules-first option. Z-score, IQR, and similar techniques are fast, understandable, and often enough for stable metrics with predictable distributions.
Their strengths are straightforward:
Low setup overhead because they don't require elaborate training pipelines
Clear behavior so analysts can usually explain why something was flagged
Good fit for baselining when you're piloting anomaly detection on a small number of metrics
Their weaknesses show up quickly in messy production environments. They can struggle with non-stationary behavior, shifting baselines, multivariate patterns, and high-volume streams where “normal” changes often.
Machine learning models
Machine learning models sit in the middle ground. They learn normal behavior from data rather than relying entirely on hard-coded rules.
That makes them more flexible than classic statistical thresholds, especially when the signal depends on several interacting variables. In practice, many enterprise anomaly detection tools target this approach. They offer stronger pattern recognition without the full complexity of deep learning systems.
A good mental model is this: statistical methods ask whether a value is too far from a defined range. Machine learning asks whether the observation fits the learned shape of normal behavior.
For teams running industrial, telemetry, or reliability workloads, this kind of distinction matters outside analytics too. This technical guide for reliability engineers is a useful companion read because it grounds machine learning choices in operational maintenance rather than abstract model performance.
Deep learning for high-frequency data
Deep learning and related advanced unsupervised methods are most compelling when the data is fast, high-dimensional, or sequential. They're often used where patterns evolve continuously and labeled anomaly data is scarce.
One example is Random Cut Forest. In high-frequency environments, deep learning algorithms like Random Cut Forest are valuable because they don't require labeled training data, and they can achieve 15 to 20% higher precision while reducing false positives by up to 40% in real-time streaming scenarios compared with traditional methods, according to this roundup of anomaly detection software and RCF performance.
That said, higher model sophistication usually comes with more operational burden. You need to think about retraining, drift, threshold tuning, and whether your team can debug the model when product managers ask why an alert fired.
A related concept appears in clustering workflows. If you're comparing pattern-learning methods more broadly, this overview of clustering algorithm comparisons helps frame why some tools are better at grouping normal behavior than others.
Approach | Complexity | Data Requirement | Best For |
|---|---|---|---|
Statistical | Low | Small to moderate history, cleaner distributions | Simple outliers, early pilots, transparent baselines |
Machine learning | Medium | Historical data with enough variation to learn normal patterns | Multivariate behavior, changing baselines, broader operational monitoring |
Deep learning | High | Large volumes, fast-moving or high-dimensional data, often unlabeled | Streaming environments, complex sequences, sparse rare events |
The best model isn't the most advanced one. It's the one your team can keep calibrated in production.
Key Features of Modern Anomaly Detection Tools
The feature list matters less than the operating consequences behind each feature. Many anomaly detection tools look similar on a website. They differ sharply once you ask who maintains the baselines, how alerts are routed, and whether the product can work across both warehouse history and live streams.
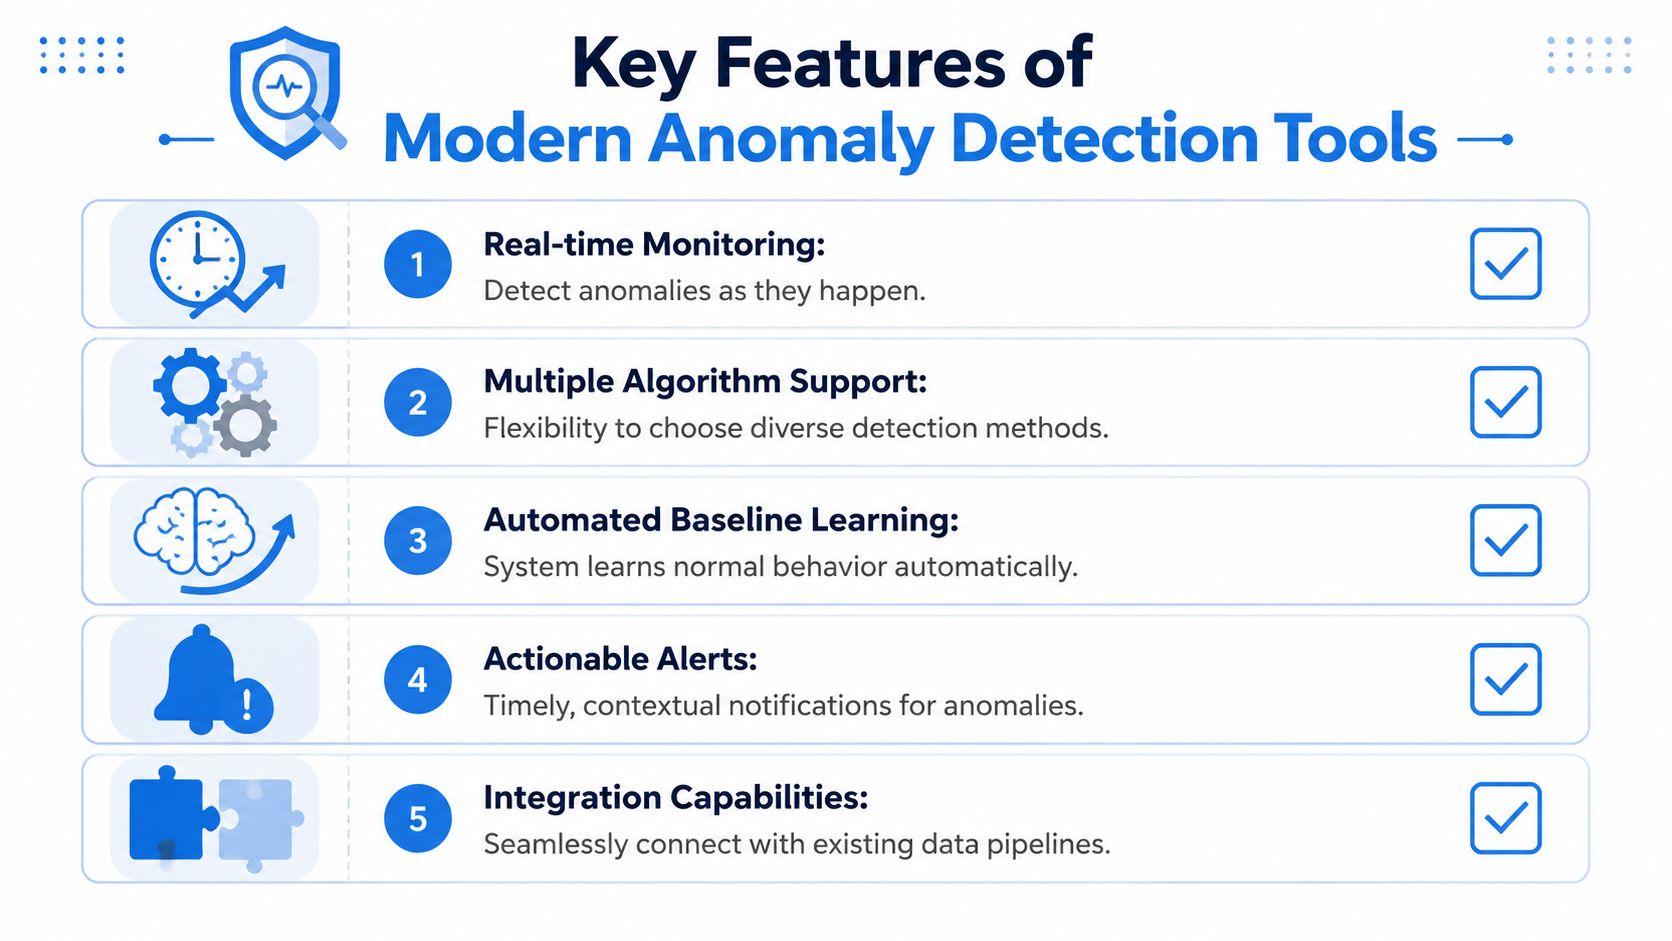
Support for batch and streaming
This is the first filter I'd apply. Some tools are built for static dataset analysis. Others are designed for low-latency stream processing. Many claim both, but the architecture often leans heavily in one direction.
Ask vendors where the model runs, how often baselines update, and whether they can evaluate historical backfills and live events in one operating model. If the answer involves separate systems, custom glue code, or manual exports, your integration burden is already rising.
For product and business analytics teams, a warehouse-native approach is often more durable because historical context already lives in the warehouse. For fraud, security, or IoT teams, stream-native detection may be essential.
Baseline learning and correlation
Good tools don't just spot outliers. They learn baselines automatically and connect anomalies across related signals.
AI-driven platforms like Anodot can monitor 100% of data streams in real time, reduce time-to-detect from 4 hours to under 15 minutes, and cut mean time to resolution by 60% by correlating anomalies and isolating root causes, according to Anodot's write-up on AI-powered anomaly detection for time-series data.
That matters because single-metric alerts create noise. Correlated anomalies create usable incidents.
Explainability and integration
Even strong detection is wasted if nobody trusts the output. Teams need to know why the system flagged something, what baseline it compared against, and what related dimensions changed at the same time.
When you evaluate explainability, ask questions like these:
What triggered the alert. Was it a point outlier, a trend break, a seasonal deviation, or a multivariate interaction?
What context is attached. Does the alert include segment breakdowns, recent changes, and likely drivers?
Where does the alert go. Slack, PagerDuty, ticketing systems, email, and warehouse workflows all create different response patterns.
If an alert can't answer “why now?” your analysts will still have to open a notebook and reconstruct the story by hand.
Scalability also belongs here. A tool that performs well on a handful of curated metrics can become expensive and noisy when the number of monitored entities grows. The right product should let you expand coverage without turning your team into alert janitors.
How to Choose the Right Tool for Your Data Stack
Choosing anomaly detection tools by algorithm alone is a procurement mistake. The winning tool isn't the one with the most advanced model sheet. It's the one your team can integrate, trust, and keep running without heroic effort.
Start with infrastructure fit
Begin with the simple question many teams skip. Where does your data live, and how fresh does it need to be?
If your operating center is Snowflake, BigQuery, Databricks, or another warehouse, you should be skeptical of tools that require heavy data movement into a separate monitoring environment. If your critical signals flow through Kafka or another event system and need immediate evaluation, a batch-first tool won't save you.
Use this short test:
Warehouse-centered team. Favor tools that work close to modeled tables, notebooks, and SQL workflows.
Streaming-centered team. Favor systems designed for event ingestion, low-latency scoring, and resilient alerting.
Hybrid environment. Look for products that can use history from batch layers and still react to fresh operational signals.
Price the human work not just the software
Most buying guides often fall short here. They compare methods and screenshots, then ignore who does the maintenance after launch.
Operational overhead is one of the biggest reasons anomaly systems fail. Industry surveys show 58% of data teams abandon these tools because of alert fatigue, and IBM notes 45% of systems fail to be sustained due to lack of automation and high maintenance requirements in its overview of machine learning for anomaly detection.
That means your real cost model should include more than vendor fees:
Initial setup work including schema mapping, metric definition, and threshold or model configuration
Ongoing tuning when seasonality shifts, new products launch, or event definitions change
Alert review effort when false positives pile up and trust falls
Integration maintenance across Slack, incident systems, dbt jobs, notebooks, and warehouse permissions
Buy for the workload you can sustain. An elegant system that needs constant babysitting is more expensive than a simpler tool that stays trusted.
Favor warehouse-native flexibility
For many modern data teams, the most practical path is a flexible, warehouse-native layer rather than a sealed black-box product. That usually means SQL-first workflows, notebook support, direct access to historical data, and enough programmability to tune models without rebuilding the pipeline elsewhere.
This is also why I'd choose extensibility over a long list of prebuilt detectors in many cases. Business logic changes. Metrics definitions change. Teams reorganize. If your anomaly system can't adapt with those changes, the integration cost shows up later.
The right question isn't “Which tool is smartest?” It's “Which tool fits our stack with the least friction and the clearest ownership?”
Operationalizing Anomaly Detection in a Modern Workflow
Failure rarely occurs due to theoretical issues. It frequently stems from the handoff between data prep, model execution, and business response.
The old workflow breaks at handoff points
The legacy workflow is familiar. An analyst exports a CSV, runs a local Python script, checks a chart, and emails a screenshot to a product manager. If the issue looks serious, someone files a ticket. By then, the context is stale and the process has already forked into side conversations.
That setup doesn't scale. It depends on a specialist being available, and it separates detection from the data system where the issue needs to be investigated.
A better pattern is to run anomaly analysis where the governed data already sits. In practice, that means warehouse-first execution, shared notebooks, reusable templates, and alerts attached directly to operational workflows. That's also why teams exploring active monitoring often end up reading about how AI enhances real-time KPI monitoring, because the point isn't just to detect odd behavior. It's to shorten the path from detection to explanation.
A warehouse-first operating model
A modern workflow looks different. Historical product usage data sits in the warehouse. A notebook applies an unsupervised model to recent behavior. The result is surfaced to both technical and non-technical users with enough context to inspect dimensions, compare baselines, and decide whether action is needed.
In high-frequency environments, Random Cut Forest is a strong fit because it doesn't require labeled data and can deliver 15 to 20% higher precision while reducing false positives by up to 40% in real-time streaming scenarios, as noted earlier from the CIO Influence source. That makes it practical for engagement telemetry, event streams, and other cases where “normal” shifts and rare failures don't come with labeled training sets.
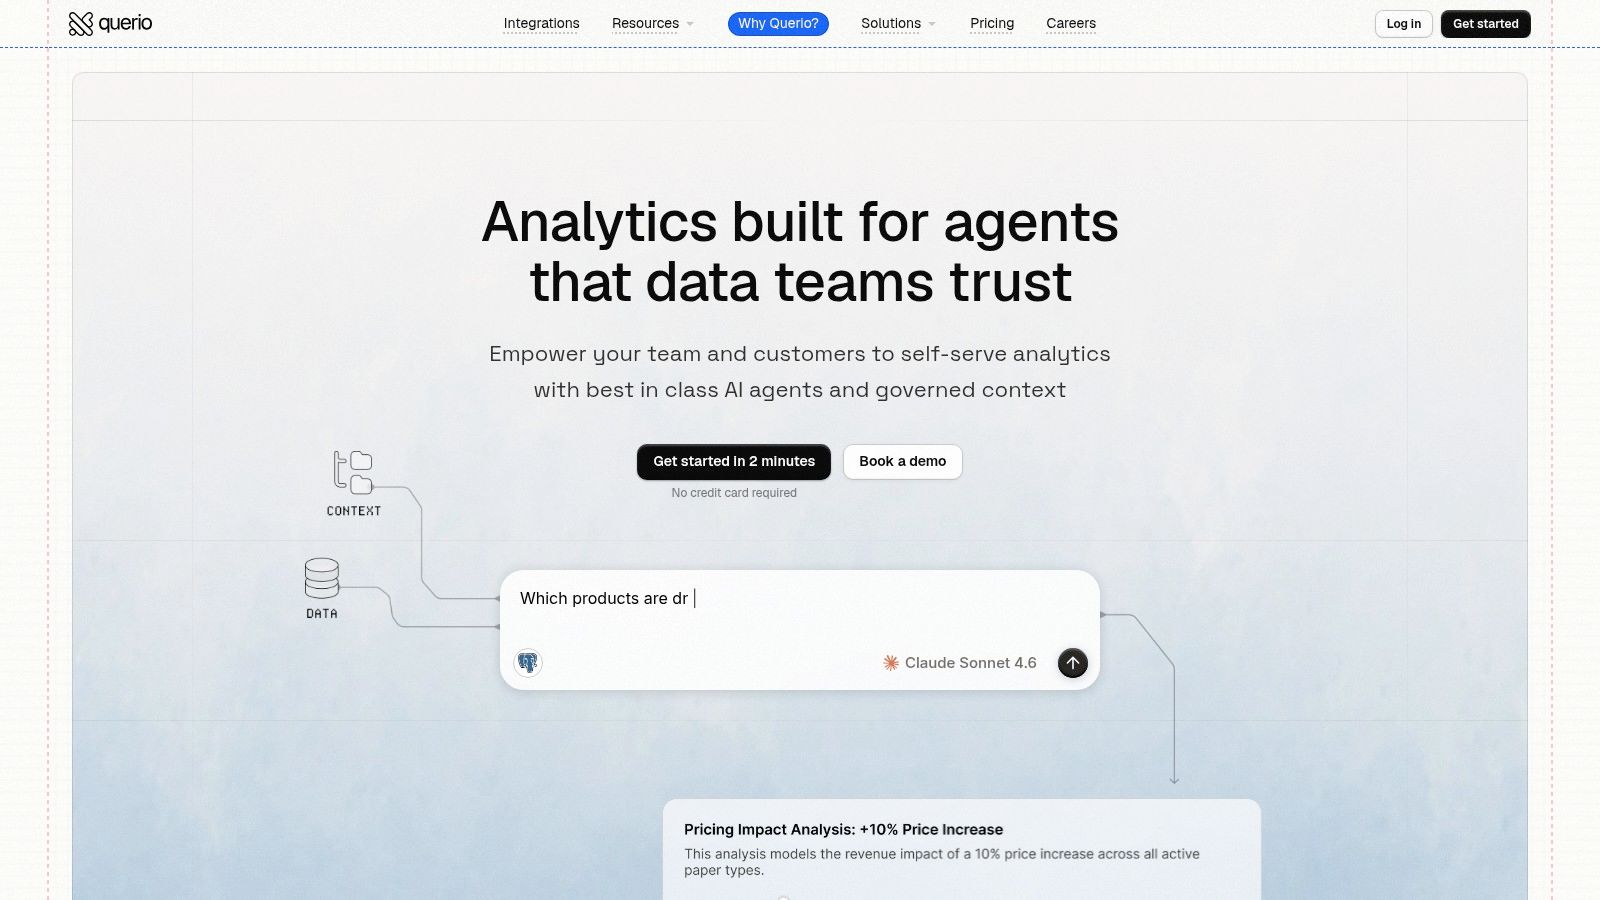
One warehouse-native option in this category is Querio, which uses AI coding agents and notebook-style workflows directly on the data warehouse so teams can build and run analyses without moving work into a separate BI silo. That matters because product managers often need to inspect anomalies in the same environment where analysts and engineers already work.
A short walkthrough helps make that concrete:
Define one monitored metric such as feature adoption, conversion rate, or failed payment volume.
Pull historical context from the warehouse so the model learns recent normal behavior.
Run a reusable notebook that scores fresh observations and flags deviations.
Attach dimensions and slices so the team can see whether the issue is isolated to a release, segment, or geography.
Route the output into the same workflow where product or operations teams already manage incidents.
This kind of setup is easier to socialize across roles because it doesn't require every anomaly to become a data science project.
Here's an example of how vendors are presenting this kind of workflow visually:
The main shift is operational, not academic. Detection moves closer to the warehouse, the feedback loop gets shorter, and analysts stop acting like a ticket queue for every “something looks off” question.
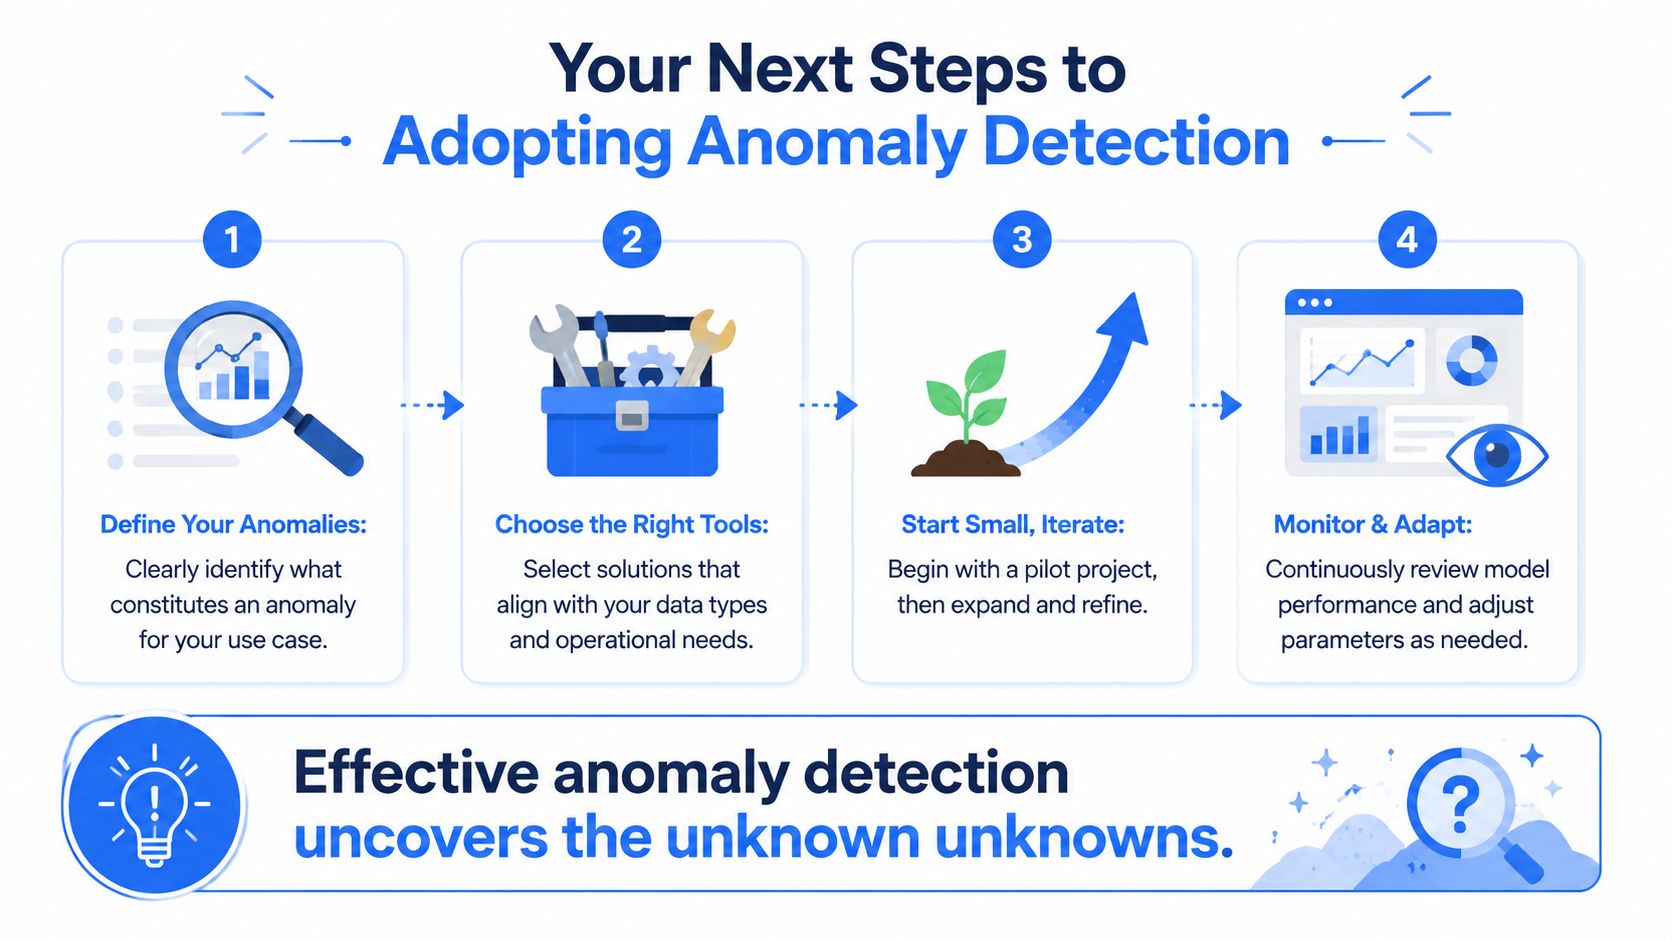
Your Next Steps to Adopting Anomaly Detection
Start with one metric that can justify the effort. A pilot around failed payments, activation rate, or incident volume will teach you more than a broad rollout across dozens of dashboards, because it forces the team to answer the hard operational questions early. Which tool owns detection. Whether the signal needs batch review or real-time response. Who investigates the alert, and how quickly.
Use this sequence:
Pick a metric with real business consequences. Choose something like activation, failed payments, churn signals, or infrastructure health. If nobody will act when it moves, it is a weak pilot.
Match the tool to the timing requirement. Batch analysis is often enough for product, finance, and growth metrics reviewed hourly or daily. Streaming detection makes sense when delays create direct cost, such as fraud, outages, or transaction failures.
Start with a simple baseline. A statistical method is often enough to establish normal behavior and expose whether the metric is stable enough to monitor well. More complex models add tuning overhead, review work, and integration effort, so they need to earn their keep.
Evaluate tools on operating fit. Check how they connect to your warehouse, event pipeline, alerting stack, and ticketing workflow. The hidden cost usually sits in setup, maintenance, and the analyst time required to explain alerts to the business.
Assign ownership from the start. Decide who tunes thresholds, who reviews anomalies, and how false positives get reduced over time.
Strong anomaly detection finds problems early. Sustainable anomaly detection costs less to run than the incidents, analyst hours, and integration work it replaces.
The teams that get value from anomaly detection are usually the ones that control total cost of ownership, not the ones that buy the most advanced model first. A tool that saves ten minutes of detection time but adds weeks of integration work, constant threshold tuning, and another interface for analysts to monitor is often a poor trade. Start where the response path is clear, keep the workflow close to the systems where the data already lives, and separate batch use cases from true streaming needs before you commit budget and headcount.
Querio is one option if you want to operationalize anomaly detection close to your warehouse instead of bolting on another isolated BI layer. Its notebook-based, warehouse-native workflow is designed for teams that want analysts, engineers, and business users to investigate unusual metric behavior in the same environment. If that operating model fits your stack, you can explore Querio.

