Your Business Intelligence Strategy for Startup Growth
Build a business intelligence strategy that drives results. A step-by-step guide for mid-market startups on aligning goals, choosing tools, and measuring ROI.
https://www.youtube.com/watch?v=X_U7Tk7HNkM
published
Outrank AI
business intelligence strategy, bi strategy, self-service analytics, startup data strategy, data governance
33737beb-81bd-44f9-abae-563d6cea86b5

Most advice on business intelligence starts in the wrong place. It starts with tooling, dashboard standards, or a warehouse redesign. Mid-market startups rarely fail at BI because they picked the wrong chart library. They fail because they built a reporting function when the company needed a decision system.
That distinction matters more in startups than in large enterprises. A startup can't afford a data team that acts like a ticket queue. Product, marketing, finance, and operations need answers while the context is still fresh. If BI only produces static dashboards, the company stays reactive. If BI helps teams ask better questions, inspect the drivers behind a metric, and act quickly, it becomes part of how the business runs.
The strongest business intelligence strategy for a startup is usually smaller than people expect. Fewer dashboards. Fewer source systems at the beginning. Fewer metrics per team. More ownership, clearer definitions, and more direct ties to operating decisions.
Table of Contents
Why Most Business Intelligence Initiatives Fail
Most BI initiatives don't fail because leaders don't care about data. They fail because the implementation turns into a disconnected reporting project. One industry analysis cites a 60% failure rate, and another says 73% fail to deliver measurable ROI, as summarized in Dataversity's review of BI initiative failure patterns.
That should change how you think about business intelligence strategy. If the baseline outcome is disappointment, then "let's buy a BI tool and build dashboards" isn't a strategy. It's procurement followed by activity.
In startups, the failure mode is usually obvious. The data team becomes a human API. Every team asks for a dashboard. Every dashboard introduces another metric definition. Every urgent request jumps the queue. Six months later, nobody trusts the numbers enough to make a hard call from them.
BI breaks when the artifact becomes the goal. A dashboard is only useful if it shortens the path from question to decision.
A practical business intelligence strategy starts with a narrower ambition. Pick the decisions that change company performance. Then design the data, ownership, and tooling around those decisions. That sounds less glamorous than a broad enterprise rollout, but it's far more durable.
The cost of traditional platform-heavy setups often shows up in hidden maintenance, dependency chains, and analyst bottlenecks. That's why startup teams should study the hidden costs of traditional BI platforms before they lock themselves into a reporting-first model.
What works instead is a builder mindset. Builders ask what data product a team needs to operate better this quarter. Reporters ask what chart needs to be shipped by Friday. One builds capability. The other creates backlog.
Aligning Your BI Strategy with Business Outcomes
The easiest way to drown a startup in data is to start with available tables instead of business priorities. Founders and functional leaders don't need more metrics. They need fewer metrics that can settle an argument, validate a bet, or trigger action.
A business intelligence strategy gets traction when it follows a top-down chain from company intent to team behavior. This visual captures that cascade clearly.
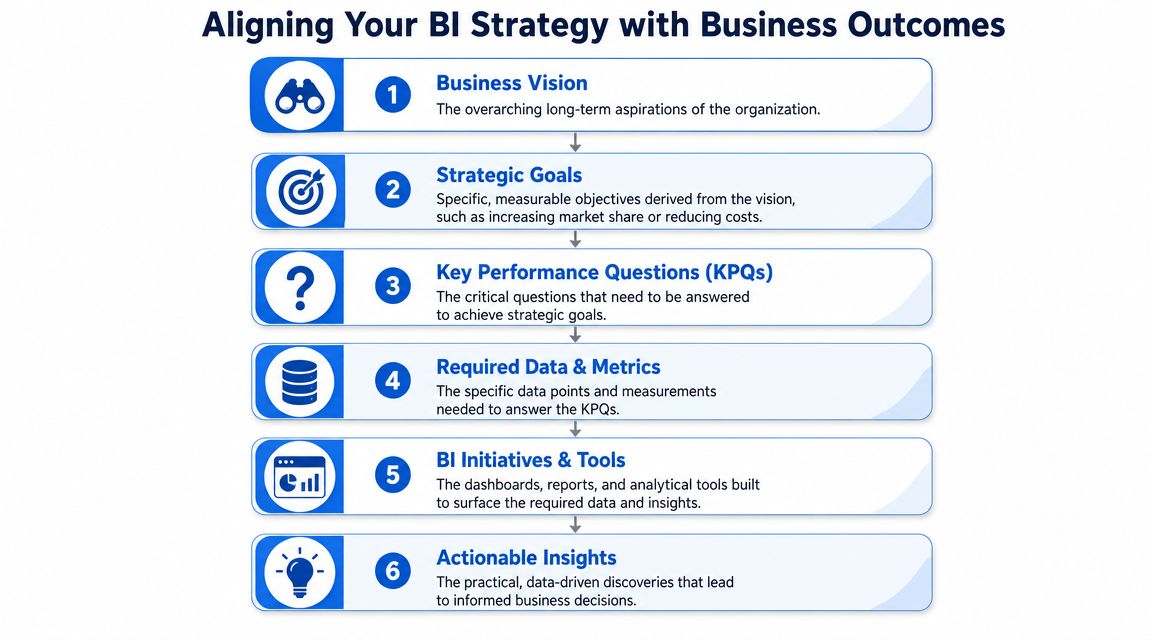
Start with decisions, not data requests
For a startup, the first question isn't "What should we track?" It's "What are the one or two decisions that matter most this quarter?"
That might be:
Product retention: Which onboarding steps correlate with activation, and where do users stall?
Go-to-market efficiency: Which acquisition channels produce accounts that expand, not just convert?
Revenue planning: Which pipeline segments are reliable enough to support hiring and spend commitments?
If you start there, BI becomes scoped by consequence. The data team can then partner with operators to define the key performance questions that sit beneath those decisions. This is also where a shared reporting language matters, especially when teams have been improvising their own metrics. A clear approach to reporting and metrics design helps keep the system tied to management decisions instead of dashboard sprawl.
A useful operating pattern is to ask every stakeholder the same three things:
What decision are you trying to make repeatedly?
What signal would change your mind?
What action follows if the metric moves?
If nobody can answer the third question, the metric probably doesn't belong in your first BI layer.
Translate objectives into a small KPI set
A 2026 BI guide recommends starting with 3 to 5 core KPIs per business unit and documenting each KPI's formula, source, and owner to create a single source of truth. The same overview says organizations with effective BI strategies report 30% higher operational efficiency and 5x faster decision-making, according to Coursera's business intelligence trends guide.
That guidance is especially useful in startups because scope is the first real enemy.
A simple pattern looks like this:
Business area | Objective | Good KPI behavior |
|---|---|---|
Product | Improve activation | Measures user progress through a defined path |
Marketing | Improve acquisition quality | Connects spend to downstream value, not just lead volume |
Sales | Improve forecast reliability | Clarifies stage movement and conversion discipline |
Customer Success | Reduce avoidable churn | Flags risk early enough to intervene |
Finance | Improve planning accuracy | Supports decisions on budget, hiring, and runway |
The point isn't to mimic another company's KPI tree. It's to force trade-offs. If a team claims it needs twelve KPIs to operate, it usually means the operating model isn't clear yet.
Here's a useful walkthrough of the same alignment logic in video form.
Document the metric contract
A KPI definition isn't complete when you've named it. It's complete when a new employee can answer four questions without opening Slack:
Formula: How is it calculated?
Source: Which system or model produces it?
Owner: Who approves changes to the definition?
Cadence: How often should users expect updates?
Practical rule: if two executives can use the same term to mean different things, you don't have a KPI. You have a future meeting.
This documentation doesn't need enterprise ceremony. A startup can keep it lightweight. The important part is that it exists, stays current, and is visible where people work.
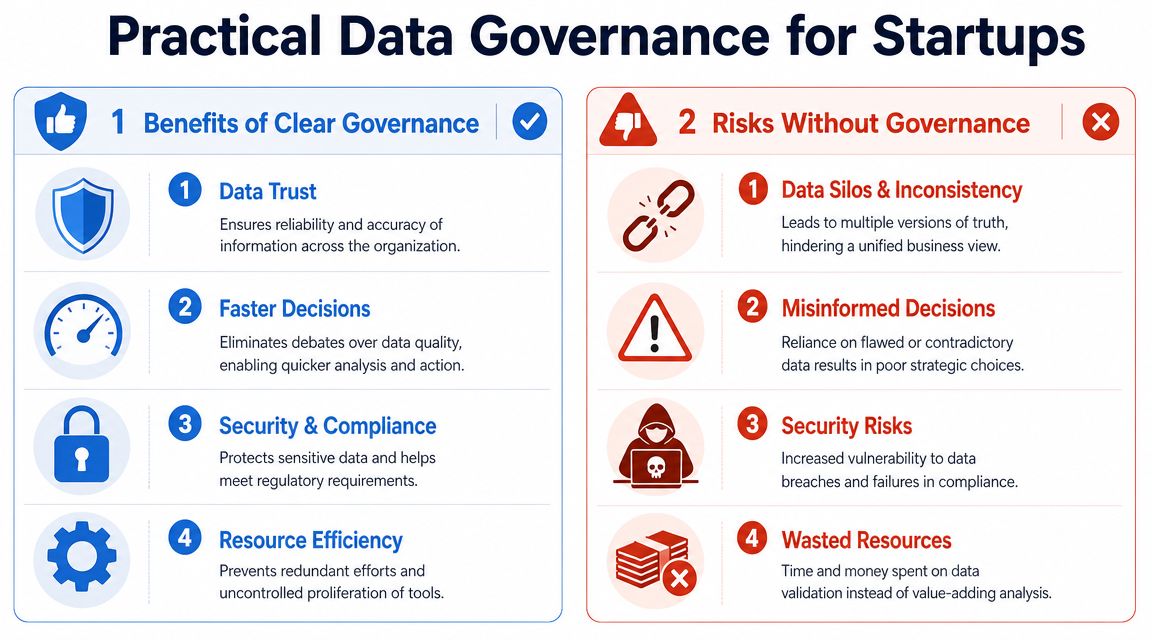
Designing a Practical Governance and Ownership Model
Governance gets framed as bureaucracy because people usually meet it too late. By the time leaders ask for governance, teams already have conflicting dashboards, duplicated logic, and access controls held together by tribal knowledge. In a startup, governance should feel more like lane markings than a compliance program.
That matters because self-service without ownership creates noise faster than it creates insight. Only 28% of employees say they're satisfied with the data tools and information available to them, and fragmented systems plus siloed data remain major barriers to adoption and value realization, according to Coursera's guide to business intelligence strategy.
Choose the model that matches your stage
I've seen three governance patterns work, but each fits a different company shape.
Centralized ownership works well when the startup still has a small data team and inconsistent analytics habits across functions. The data team owns modeling, dashboard logic, and metric definitions. You get consistency. You also get a queue.
Decentralized ownership fits companies with strong analytical talent embedded in product, finance, or growth teams. Domain teams own their metrics and reporting. This increases speed, but metric drift becomes a real risk if definitions aren't shared.
Hybrid ownership is the model most mid-market startups eventually need. A central data team owns core models, semantic standards, access patterns, and governance. Functional teams own the domain questions, local analyses, and operational use of the outputs.
Here's the trade-off in plain terms:
Model | Strength | Main risk | Best fit |
|---|---|---|---|
Centralized | Consistency | Slow response times | Early-stage or low-maturity teams |
Decentralized | Speed | Metric inconsistency | Analytics-heavy departments |
Hybrid | Balance of trust and agility | Requires role clarity | Mid-market startups scaling across functions |
The hybrid model usually wins because it matches how startups operate. Shared infrastructure in the center. Decision context in the domains.
Build guardrails before broad access
A practical governance model needs explicit answers to a short list of questions:
Metric ownership: Who owns each company KPI?
Validation: What has to happen before a metric is considered trusted?
Change control: Who reviews a definition change?
Access: Which users can see raw, sensitive, or executive-level data?
Lifecycle: When does a dashboard get archived instead of lingering forever?
A good starter framework for this lives inside a lightweight data governance implementation plan. The key is to keep the process proportional. A startup doesn't need a committee for every field rename. It does need clarity on the handful of metrics that drive executive decisions.
Good governance doesn't slow self-service. It stops teams from self-serving the wrong answer.
The single source of truth isn't a dashboard. It's the combination of trusted definitions, governed datasets, and named owners. Once that exists, dashboards become outputs rather than political artifacts.
Architecting Your BI Stack for True Self-Service
Tool selection gets too much attention, but architecture doesn't get enough. Two companies can buy the same platform and end up with opposite outcomes depending on who can ask questions, who can inspect logic, and who gets blocked when a question changes.
For a startup, the BI stack should reflect an operating model, not just a procurement checklist. Organizations often end up choosing among three broad architectures.
Three architectures, three operating models
The first is the traditional dashboard stack. Think Looker, Tableau, or Power BI. These platforms are strong when leadership wants standardized reporting, curated metrics, and repeatable dashboards. They struggle when non-technical users need to explore beyond the predefined view.
The second is the notebook-centric stack. Tools like Hex support deep analysis, flexible workflows, and code-based exploration. This works well for analysts, analytics engineers, and technically fluent product teams. It tends to exclude operators who don't write SQL or Python.
The third is the AI-assisted analytics layer. These systems let users ask questions in plain English and generate queries or analyses on top of warehouse data. Querio is one example of this model. It deploys AI coding agents on the warehouse and uses a file system approach with Python notebooks so both technical and non-technical users can query and build on company data. This architecture shifts the data team away from ad hoc request handling and toward maintaining reusable analytics infrastructure.
Here's the practical comparison:
Approach | Primary User | Flexibility | Time to Insight |
|---|---|---|---|
Traditional BI dashboards | Executives and business teams consuming standard reports | Moderate within predefined models | Fast for recurring questions |
Code-based notebooks | Analysts, data scientists, technical product teams | High | Fast for technical users, slower for everyone else |
AI-powered analytics agents | Mixed technical and non-technical teams | High when governance is in place | Fast for exploratory questions |
How to choose for a mid-market startup
Start with your constraint, not your preference.
If the company mostly needs board reporting, operating reviews, and fixed KPI visibility, a dashboard-first setup is often enough. If product and growth teams run frequent experiments and need deep one-off analysis, notebooks become more useful. If your bottleneck is that business users wait on analysts for basic exploration, an AI-assisted layer can reduce that dependency.
The harder question is whether your tooling encourages curiosity or just publication.
A lot of BI environments claim to be self-service when they really mean self-navigation. Users can click filters on a dashboard, but they can't ask a follow-up question without opening a ticket. That's not self-service. That's consumption with nicer UI.
The architecture should also match your governance maturity. The more open the querying layer, the more important your core models and metric contracts become. Otherwise speed just amplifies inconsistency.
For teams evaluating this shift, it helps to think in terms of what real BI self-service requires, not just which interface looks easiest in a demo. The right choice is the one that reduces decision latency without multiplying conflicting answers.
Creating a Phased Implementation Roadmap
A big-bang BI rollout sounds efficient because it promises a unified system all at once. In practice, it's one of the fastest ways to burn trust. The safer path is narrower: solve one important problem, prove the workflow, then expand with discipline.
A phased roadmap also matches how startups learn. You don't know your real BI requirements until teams start using the system under pressure.
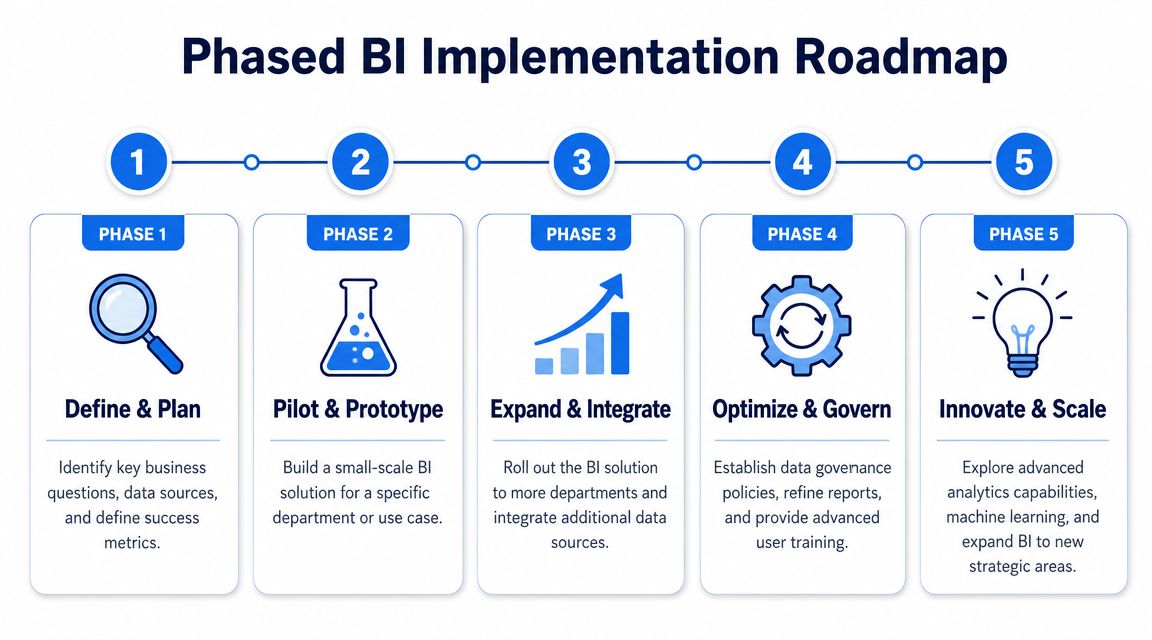
Phase one proves value fast
The pilot should be small enough to finish quickly and important enough that people care if it works.
A strong pilot has three characteristics:
One business-critical decision: Pick a use case with visible operational consequences, such as retention diagnosis, pipeline quality, or onboarding performance.
Two or three essential source systems: Resist the urge to integrate everything. You need only the systems required to answer the decision at hand.
Named users and actions: Know exactly who will use the output and what they'll do differently with it.
Many teams overbuild. They design for future completeness instead of current usefulness. For a startup, the right pilot is usually a thin slice of the eventual platform.
Build the minimum data product that changes a recurring decision. Leave the rest for later.
The pilot should also force a few basic disciplines. Define the metric logic. Assign ownership. Make the data refresh expectation explicit. If the pilot works, those patterns become your template.
Phase two standardizes what worked
Once the pilot proves useful, expand sideways rather than everywhere. Take the same operating pattern to adjacent teams or neighboring decisions.
For example, a product retention pilot might expand into lifecycle marketing. A revenue forecast model might expand into sales capacity planning. The point is to grow through related use cases that share definitions and underlying models.
During this stage, focus on operational consistency:
Codify metric definitions from the pilot into shared documentation.
Refactor brittle logic that was acceptable in a test but won't scale.
Rationalize dashboard inventory so teams don't inherit duplicate views.
Tighten permissions as more stakeholders come into the system.
Phase two is where many data teams regain a more advantageous position. Instead of recreating similar analyses in different formats, they promote reusable models and governed datasets.
Phase three turns BI into infrastructure
By the time you scale access broadly, the data team should stop acting like a service desk.
That means the team's job shifts toward:
Maintaining trusted models
Publishing reusable semantic definitions
Supporting exploration patterns
Training teams on how to answer their own questions
This stage isn't about opening every dataset to everyone. It's about creating a reliable path from question to answer that doesn't require analyst intervention for ordinary work.
The startups that scale BI well usually make one cultural shift here. They stop evaluating success by dashboard output and start evaluating it by how many important decisions can happen without waiting on the data team.
Driving Adoption and Measuring Your BI ROI
Adoption isn't a launch event. It's a behavior change. Teams use BI when it helps them do their jobs inside the rhythm they already have. They ignore it when it becomes an extra destination, maintained by someone else, with unclear relevance to today's decision.
That means your business intelligence strategy has to include communication, workflow design, and feedback loops. It also needs a credible answer to the finance question behind every data investment: was this worth the time, headcount, and tool spend?
The answer matters because BI isn't a side category anymore. One market projection estimates the global BI market will grow from $38.15 billion in 2025 to $116.25 billion by 2033 at a 14.98% CAGR, according to Fortune Business Insights' BI market projection. Companies keep investing because they expect BI to shape operating performance, not because they want prettier dashboards.
Adoption happens in workflows, not training decks
The common mistake is to announce a new BI environment, run a one-time training, and assume the company will naturally become data-driven.
It won't.
People adopt analytics when the system is tied to existing rituals:
Weekly leadership reviews: Metrics shown there become real because decisions follow immediately.
Product and growth standups: Teams revisit experiments and funnel movement with shared definitions.
Pipeline and forecast calls: Sales leaders rely on the same numbers used in planning.
Customer health reviews: Success teams act on governed risk signals rather than anecdotal escalation.
A few practical tactics work well in startups:
Office hours: Give teams a recurring place to ask questions and debug confusion.
Embedded champions: Pick functional users who can translate business context into better data usage.
Visible wins: When a team avoids a bad decision because the data was clear, share that story internally.
Fast feedback loops: If users find a broken metric or ambiguous definition, fix it quickly and publicly.
If users have to remember a separate BI ritual, adoption will be weak. If BI is built into the meeting where decisions happen, usage becomes durable.
Measure ROI through changed decisions
Tool usage alone is a poor ROI metric. Logins, dashboard views, and query counts tell you whether people touched the system. They don't tell you whether the business got sharper.
A better approach is to tie ROI to the business outcomes and decisions you defined upfront.
Look for evidence in four areas:
ROI lens | What to examine |
|---|---|
Decision speed | Are teams resolving recurring questions faster than before? |
Decision quality | Are leaders using shared metrics instead of debating definitions? |
Operating leverage | Is the data team spending less time on repetitive requests? |
Business movement | Did the target metric tied to the original use case improve enough to justify continued investment? |
This is one place where qualitative evidence matters. In startup environments, the early payoff often appears as fewer escalations, cleaner planning conversations, and faster iteration loops before it appears neatly in a finance model.
That doesn't make it soft. It makes it operational.
Treat BI as a capability that compounds
The best startup BI systems don't just answer known questions. They make the company better at forming new ones.
That's the shift from reporting to exploration. Reporting tells you where a number landed. Exploration helps a PM, founder, or operator ask why it moved, what segment drove it, whether it's a data issue or a real behavior change, and what to test next.
A business intelligence strategy should evolve with the company. New product lines, pricing changes, channel shifts, and team growth all create new decision points. If the underlying models, metric ownership, and self-service patterns are sound, the system adapts. If they aren't, every new business question feels like a rebuild.
The startup advantage is speed. BI should protect that speed, not bury it under dashboards nobody trusts.
Querio fits this shift for teams that want self-service analytics on top of the warehouse without turning the data team into a permanent request queue. Its AI coding agents, natural-language querying, and notebook-based workflow can support both technical and non-technical users who need to explore data and build reusable analyses. If you're rethinking your business intelligence strategy with Querio, evaluate it the same way you should evaluate any BI platform: by how much decision latency it removes, how well it preserves metric trust, and how effectively it lets your team scale analysis without scaling bottlenecks.

