Mastering Conversion Funnel Analysis with SQL & Python
Learn a step-by-step framework for conversion funnel analysis in your data warehouse. Use SQL/Python to diagnose drop-off, beat BI tools, and drive growth.
https://www.youtube.com/watch?v=p0ZAjUf1h4A
published
Outrank AI
conversion funnel analysis, data warehouse, sql analytics, product analytics, cohort analysis
f9d449e7-b289-424d-9ac8-f83b9e784844

A product manager pings you with the same question every data team hears: users are dropping somewhere between signup and activation, and nobody knows why. The dashboard shows a decline. The weekly KPI deck shows another decline. The event stream in the warehouse looks like a crime scene.
That's the moment when basic funnel charts stop being useful.
Organizations don't need another canned report. They need a conversion funnel analysis process that starts with raw events, survives bad instrumentation, and produces something product and growth teams can act on. If you build it directly in the warehouse, you control the event definitions, the identity logic, the segmentation model, and the time windows. You also inherit the messy parts, which is exactly why the work is more valuable.
Table of Contents
Beyond Canned Funnel Reports
Prebuilt funnel widgets are fine until someone asks a real question. Why does paid traffic convert differently from product-led signups? Which users skipped onboarding but still activated? Did the drop start after a release, or after a tracking change?
Most BI tools answer the easiest version of the problem. They count users across a fixed sequence and stop there. That's useful for status reporting, but weak for diagnosis.
Warehouse-first analysis changes the job. You stop asking, “What's the top-line conversion rate?” and start asking, “Which exact transition broke, for whom, and according to which identity rules?” That's a better frame because a mature funnel often has one or two leaky steps responsible for 60% to 80% of the total drop-off, and fixing those steps can raise completion rates by 20% to 40% without adding new features, according to UXCam's explanation of modern funnel diagnostics.
The problem with canned reports
A standard report usually hides four decisions that matter:
Identity logic: Does the report use anonymous IDs, account IDs, user IDs, or a stitched identity graph?
Ordering logic: Must events happen strictly in order, or can users enter in the middle?
Time logic: Is the funnel same-session, same-day, or open-ended?
Step logic: Is each step represented by one event, or by a business condition assembled from multiple tables?
Those choices aren't implementation details. They determine whether the analysis reflects reality.
The fastest way to lose trust in a funnel is to treat instrumentation choices as if they were neutral.
Why the warehouse wins
In the warehouse, you can express the funnel exactly as the business understands it. You can join CRM attributes, subscription state, acquisition source, product events, support interactions, and billing outcomes in one model. You can rerun the same analysis under different assumptions instead of arguing over screenshots.
That flexibility matters even more when teams debate whether SQL or notebooks should own the workflow. In practice, both have a place. A good breakdown of the trade-offs is this comparison of SQL vs Python for analytics work. SQL is usually the right layer for the canonical funnel model. Python is often better for path exploration, sanity checks, and custom visual diagnostics.
The shift is operational. Funnel analysis isn't a slide for the Monday meeting. It's a repeatable debugging system for growth, onboarding, checkout, and sales handoffs.
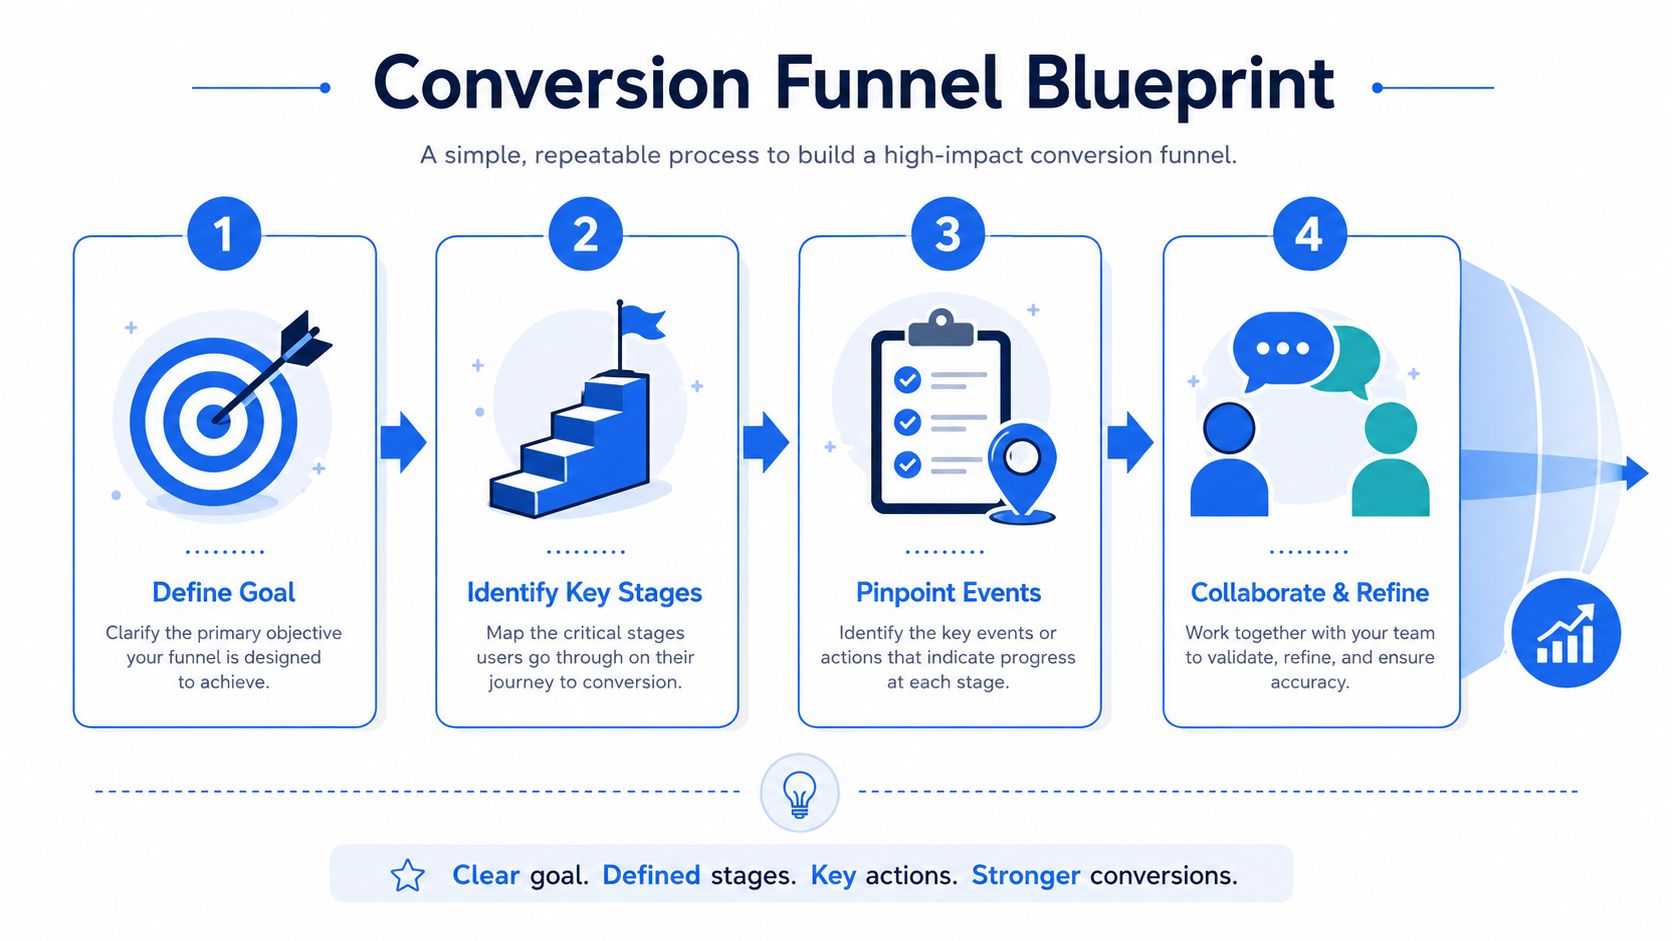
Laying the Foundation with Stages and Events
Most bad funnel analysis starts before the query. The failure point is usually conceptual. Teams mix business goals, UI clicks, and tracking events into one blurry definition, then wonder why the output isn't actionable.
A rigorous approach starts by defining each stage, collecting stage-transition timestamps and prospect attributes, then calculating step-by-step conversion and drop-off rates before segmenting by source, demographics, and time period to isolate bottlenecks, as outlined in Count's guidance on sales funnel analysis.
Define the business journey first
Start with one journey that matters commercially or operationally. Don't build a giant all-company funnel on day one. Pick a single flow such as:
Self-serve SaaS onboarding: visitor → signup → workspace created → first project created → teammate invited
Checkout: product viewed → cart created → checkout started → payment submitted → order completed
B2B lead flow: visitor → lead → MQL → SQL → opportunity → closed-won
Then decide whether you're modeling a macro funnel or a micro funnel.
A macro funnel follows the business outcome across systems. A micro funnel isolates one part of the product experience, such as onboarding completion or feature adoption. Macro funnels are better for executive alignment. Micro funnels are better for product debugging.
Map stages to warehouse reality
Every stage needs a concrete representation in data. To achieve this, analysts need product managers and engineers in the same conversation.
A clean stage definition usually includes:
Stage | Business meaning | Warehouse representation |
|---|---|---|
Signup | User creates account |
|
Workspace created | User reaches first setup milestone |
|
Activation | User completes first value action | event or derived condition from multiple events |
Paid conversion | User becomes customer | billing table status plus timestamp |
Don't assume one event equals one truth. Sometimes the most reliable stage is derived. “Activated” might require a created record, a completed task, and a non-test workspace. “Paid” might come from a billing table, not a frontend event.
Practical rule: if a stage matters to revenue or retention, validate it against the source of truth, not just the tracking plan.
Three details matter early:
Entry condition
Decide who enters the funnel. All users, only first-time users, only qualified leads, or only accounts in a certain plan state.Completion window
Define how long users have to complete downstream steps. This changes the result more than typically expected.Grain
Choose whether the funnel is tracked at user, account, session, or opportunity level. On B2B products, account-level funnels often make more sense than user-level funnels.
If these definitions are fuzzy, the SQL won't save you.
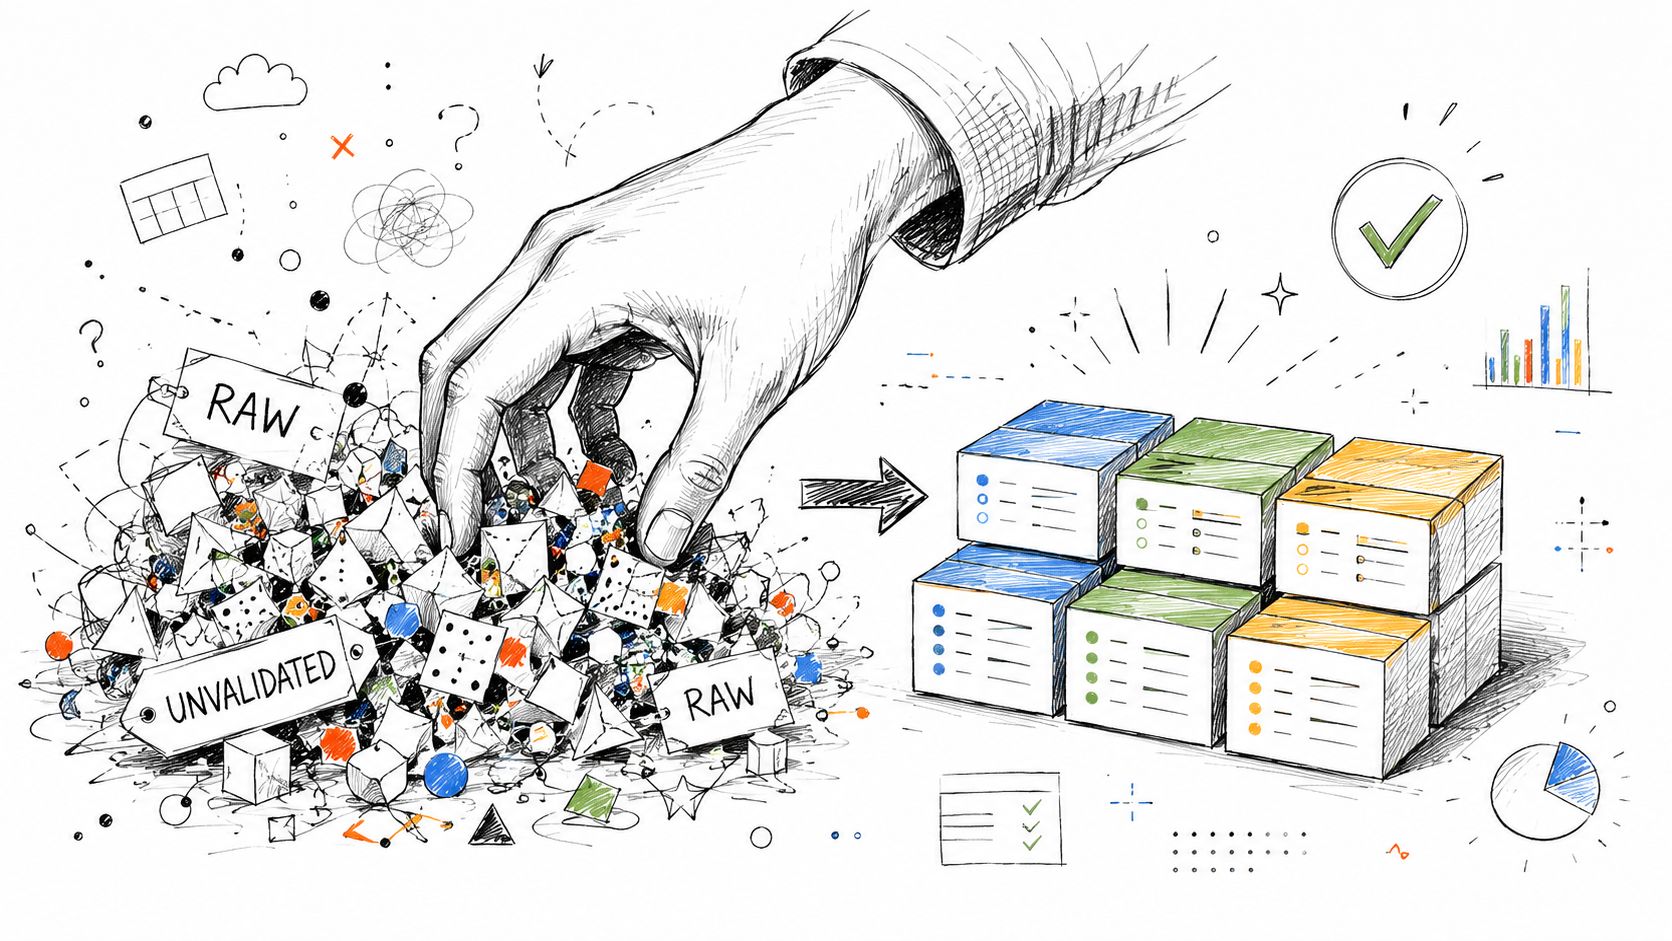
Preparing Raw Event Data for Analysis
The warehouse is where funnel analysis becomes honest. It's also where you find out your events are duplicated, renamed three times, missing IDs on mobile, and delayed by a payment provider webhook.
That cleanup work isn't optional. Common failure points in funnel tracking are often technical. Goal-tracking issues frequently stem from technical errors, an omitted page in the funnel definition, or problems with payment-gateway events, and examining the actual user path after data collection can reveal those discrepancies, as described in CXL's funnel analysis guide.
Audit the event stream before analysis
Before building a funnel table, run warehouse checks that answer simple but critical questions.
Are events duplicated?
Look for repeatedevent_idvalues, or repeated(user_id, event_name, timestamp)combinations within a narrow interval.Are event names stable?
Teams often havesignup_completed,user_signup, andsigned_upall representing the same action.Are identifiers complete?
Missinguser_id, stale anonymous IDs, or account IDs that appear only after signup can fracture the funnel.Are timestamps plausible?
Steps shouldn't happen before prerequisite records exist, and event timezones shouldn't shift unnoticed between sources.
A simple validation query often surfaces most of the pain:
This is the kind of work that sits close to mastering BI engineering. Good BI engineering isn't just dashboard polish. It's durable semantic logic, testable pipelines, and enough skepticism to reject broken instrumentation before it reaches executives.
Sessionize only when the question requires it
Not every funnel needs sessions. Many teams add sessionization because tools do, not because the business question requires it.
Use sessions when context matters. Checkout friction, ad-landing-page behavior, and same-visit activation often benefit from session boundaries. Don't use sessions for long consideration cycles unless you're deliberately analyzing same-session completion.
A practical rule set:
Use user-level funnels for onboarding, trial conversion, and longer product journeys.
Use account-level funnels for sales-assisted B2B flows.
Use session-level funnels for immediate interactions such as web conversion paths.
For cleaning and exploratory QA, Python can help inspect anomalies faster than SQL alone. Notebooks are especially useful when you need to profile naming drift, timestamp gaps, or malformed properties at scale. This guide on using Python for data analysis is a useful reference if your team mostly works in SQL and needs a practical bridge.
Building the Funnel with SQL and Python
Once the data is usable, the build itself is straightforward. The hard part is being explicit about assumptions.
Keep the first version boring. One row per entity. One timestamp per stage. One definition for conversion. Then layer in cohorts and segment dimensions after the base table is stable.
Start with a step table
First, create a normalized event view with the fields you need.
Example Raw Event Data Structure
event_id | user_id | event_name | timestamp | properties |
|---|---|---|---|---|
evt_1 | 101 | user_signed_up | 2026-06-01 10:00:00 | json |
evt_2 | 101 | workspace_created | 2026-06-01 10:02:00 | json |
evt_3 | 101 | project_created | 2026-06-01 10:05:00 | json |
Then collapse raw events into first-step timestamps per user.
This table becomes the spine for the funnel.
Build a sequential SQL funnel
The key is enforcing order without overcomplicating the query. A simple approach checks whether each downstream timestamp exists and occurs after the prior step.
For more flexible step logic, window functions are cleaner than repeated joins. They're especially helpful when users can repeat actions or when you need next-step ordering across dense event streams. This reference on window functions in SQL is worth keeping nearby for those patterns.
If your funnel logic can't be explained in plain English, it probably shouldn't be in production yet.
A practical enhancement is adding a completion window. For example, only count downstream steps that occur within a defined period of signup. That protects the analysis from counting conversions that happen much later and belong to a different lifecycle moment.
Add cohort output and visualization
Cohorts make the funnel useful for trend analysis. Instead of one aggregate output, group users by their entry period.
Once the query is solid, a short Python notebook can visualize absolute counts and relative conversion between steps.
Later, if your team wants a notebook interface on top of warehouse-native queries, tools like Hex or a warehouse-connected notebook environment can work. Querio also supports Python notebooks and file-based analytics workflows directly on warehouse data, which fits teams that want funnel analysis, conversion analysis, and related product analytics without forcing everything into a dashboard layer.
A walkthrough can help if you want to see how analysts present this kind of work in practice.
Diagnosing Drop-Off with Segmentation
An aggregate funnel is usually too smooth to be trustworthy. It averages across acquisition channels, devices, account types, and user intent levels that behave nothing alike.
That's why segmentation is where conversion funnel analysis becomes diagnostic. Popular guides often focus on charting stages and bottlenecks, but a recurring problem is that drop-off can come from measurement choices, not just user behavior. Funnels can be distorted by stage definitions or weak cross-device deduplication, and in complex products users often enter mid-funnel or loop back, which makes a simple top-to-bottom model misleading, as noted in Unbounce's discussion of funnel modeling pitfalls.
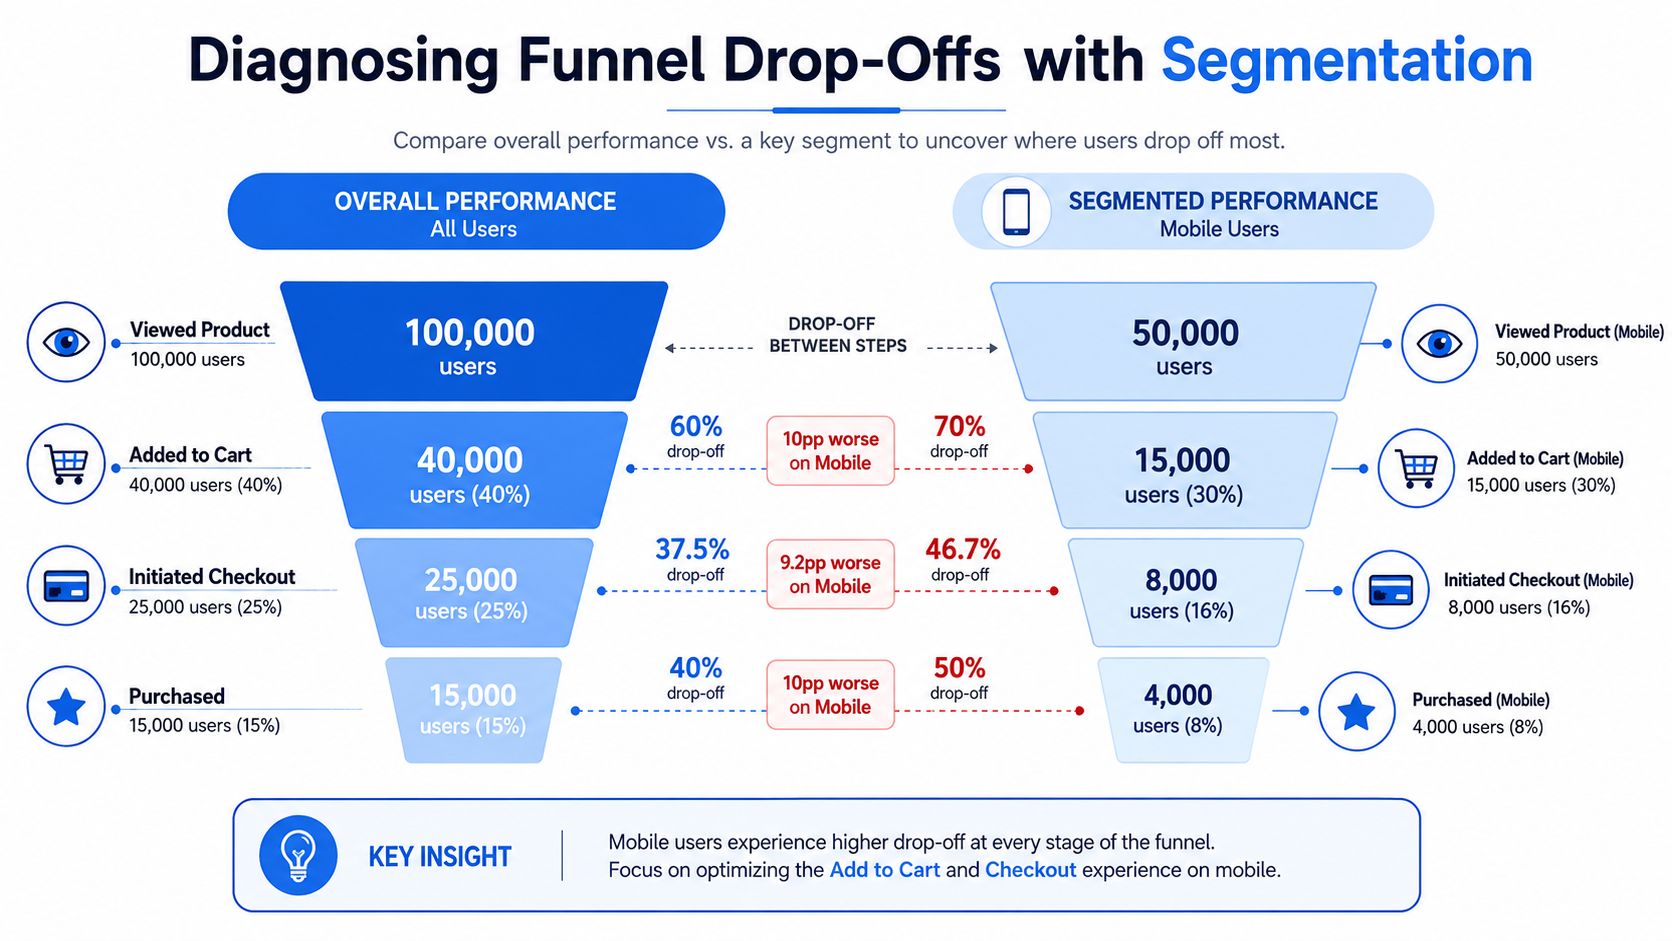
Why the aggregate funnel lies
Suppose overall conversion from signup to activation looks acceptable. That doesn't mean the experience is healthy. It may mean one segment performs very well while another is subtly broken.
Useful segment cuts usually include:
Acquisition source: paid search, organic, partner, product referral
Platform: mobile web, desktop web, iOS, Android
Customer shape: company size, self-serve vs sales-assisted, plan type
Behavioral cohort: users who used a key feature, invited teammates, or connected an integration
Time cohort: signup week or month, especially around launches
The warehouse makes this easy because the funnel table can join directly to attribution, CRM, billing, and product dimensions.
Segment only on dimensions that could plausibly change user behavior. Otherwise you create noise, not insight.
This is also why broader segmentation strategy matters outside the funnel itself. If your team is rethinking how it defines customer groups for GTM and product decisions, this piece on strategies for B2B growth in 2025 is a useful companion. Better segment definitions usually improve funnel interpretation.
When the funnel model itself breaks
Some products don't behave like a neat staircase. Users return from email links, start from shared workspaces, upgrade before “activation,” or complete steps in parallel. In those cases, forcing every path into a strict sequence creates fake leakage.
There are a few signs your model is too linear:
Symptom | Likely issue | Better approach |
|---|---|---|
High drop-off at a step users can skip | Funnel assumes required sequence | Redefine the stage as optional or branched |
Conversion appears lower on cross-device users | Identity stitching is weak | Analyze at account level or improve deduplication |
Users “drop” then later convert | Window is too narrow | Add lag analysis or cohort completion curves |
When this happens, path analysis often beats funnel analysis. Pull event sequences for users who reached the end state and inspect how they got there. You're looking for loops, alternate entries, and skipped steps.
A practical workflow is:
Build the canonical funnel.
Segment the largest drop.
Inspect real paths for users who stalled and users who completed.
Decide whether the issue is friction, instrumentation, or model mismatch.
That fourth step matters more than is often acknowledged. A misleading funnel often triggers the wrong roadmap work.
Turning Insights into Optimization and Monitoring
A funnel is only useful if it changes decisions. Otherwise you've built a neat warehouse artifact that nobody uses.
Benchmarks help calibrate urgency. In practical guidance, many sales funnels convert only 3% to 10% overall, with B2B funnels often lower at 1% to 5% because buying cycles are longer. Step-level benchmarks commonly place Website Visitor → Lead at roughly 1% to 5% and MQL → SQL at 13% to 26%, which is why early and mid-funnel steps usually deserve more scrutiny than late-stage close rates, according to VWO's overview of funnel conversion benchmarks.
Turn leakage into a ranked backlog
The best teams translate funnel findings into hypothesis-driven work. Not “improve onboarding.” Something tighter.
Examples of strong hypothesis framing:
Mobile checkout users stall on payment submission because form fields are too cumbersome on small screens.
Trial accounts with no invited teammates fail to activate because value depends on collaboration.
Paid acquisition leads underperform at qualification because the landing page sets the wrong expectations.
Then prioritize by combining three questions:
How many entities hit this step?
How severe is the drop at this point?
How confident are we that the cause is real and fixable?
That's where conversion analysis starts to overlap with experimentation and product ops. Teams often pair funnel output with retention, cohort analysis, and A/B testing rather than treating the funnel as a standalone system. For product teams operating without a large analyst bench, this guide to product analytics without a dedicated data analyst is a practical example of how to operationalize the work.
For teams focused on site conversion in particular, these expert insights on website conversions are useful once you've already isolated the step and segment that need attention.
Monitor the funnel like a production system
Manual reruns don't scale. Once the funnel definition is stable, treat it like a production metric model.
A good monitoring setup includes:
Versioned SQL models so step logic changes are reviewable
Automated freshness checks on source events and critical dimensions
Threshold alerts when step conversion or step volume shifts unexpectedly
Release annotations so analysts can separate product impact from tracking regressions
One caution from experience. Many “funnel drops” are really broken events, changed page flows, or identity stitching failures. Alerting should notify both the product owner and the data owner, because either side can be the root cause.
If the process works, the conversation changes. Instead of arguing over a red number in a dashboard, the team sees which step changed, which segment it hit, and whether the issue is product friction or measurement drift.
Querio fits this workflow when teams want warehouse-native analysis with AI coding agents and Python notebooks on top of company data, without relying entirely on traditional BI layers. If your data team is overloaded and funnel work keeps turning into one-off requests, Querio is one option for building more durable self-serve analytics on the warehouse.

