User Behavior Tracking: A Complete Guide for Product Teams
Master user behavior tracking with proven methods for event taxonomy, key metrics, and analysis techniques that drive product growth and retention.
https://www.youtube.com/watch?v=EDAMDVg-8Cc
published
Outrank AI
user behavior tracking, product analytics, event tracking, behavioral data, retention metrics
40f6e444-6e03-4263-b8ea-ee437dc96d91

You can have plenty of users and still feel blind. The dashboard says traffic is up, the pipeline says signups are healthy, and yet nobody can tell you why people disappear after onboarding, which feature they use, or which first actions predict retention. That's the gap user behavior tracking is meant to close, and for most product teams it starts as a messy mix of event logs, session replays, and tool overload.
Table of Contents
Why Product Teams Struggle to Understand User Behavior
A common pattern shows up fast. A product team can name every acquisition channel, but when asked why users leave after signup, the answer turns fuzzy. One person points to onboarding, another blames the feature set, and the analyst has a chart full of pageviews that still doesn't explain what users did.
That gap usually starts with the measurement model. Older web analytics was built around traffic and page counts, while product work depends on actions, journeys, and outcomes. Modern behavior analytics treats click patterns, scroll depth, time on page, navigation paths, form interactions, session duration, feature adoption, activation rate, churn, and retention as the signals that matter, because the focus shifts from raw visit counts to what users do once they arrive as described in modern user behavior tracking guidance.
The real failure isn't missing dashboards
Teams usually don't lack data, they lack a model that connects behavior to product outcomes. You can see signups, but if you haven't defined the events that mark activation or the sequence that leads to retention, the raw data stays decorative.
Practical rule: if your team can't name the action that means a user reached value, your analytics setup is still incomplete.
That is why behavior tracking has become infrastructure for growth teams, product managers, and data teams. It is not a narrow marketing layer anymore. It is the operational system that shows whether users reach an aha moment, where they stall, and which behaviors predict repeat usage in product analytics frameworks that map onboarding, conversion, and retention.
Fragmentation turns simple questions into multi-tool detective work
The pain gets worse when event data lives in one tool, session replay in another, and business reporting somewhere else. Each tool solves a slice of the problem, but none of them give a unified view of the journey.
That setup pushes teams into meetings instead of queries. A warehouse-first model avoids that trap because the behavior layer sits in the same system as revenue, account, and support data. If you have ever felt blocked by that handoff, this internal perspective on how data teams stop becoming the bottleneck connects directly to the operational pain.
The practical takeaway is simple. If you only track traffic, you know demand. If you track behavior, you know progress.
The Three Tracking Methods That Power Modern Analytics
Behavior tracking matured when teams stopped treating every visit like a standalone pageview and started capturing events. A timestamped event is a cleaner unit of analysis because it lets you follow what happened, when it happened, and under what conditions. From there, the main question becomes how the event reaches your system.
Client-side tracking captures the user experience
Client-side tracking is the closest thing to watching the interface through the user's eyes. It's strong at recording clicks, scrolls, form interactions, navigation choices, and other UI context because it runs where the interaction happens. That makes it useful for diagnosing friction in onboarding, comparing button usage, and understanding what users do before a conversion step.
The trade-off is reliability. Client-side events can be blocked, interrupted, or dropped when connectivity fails. They're also best at context, not authority, so they shouldn't be the only source of truth for account changes or transactions.
Server-side tracking records authoritative actions
Server-side tracking is cleaner for system-defined events like purchases, subscription changes, account updates, or feature entitlements. Those events are harder to lose and easier to trust because they're captured after the system confirms the action. That makes server-side records valuable for billing logic, activation states, and any workflow where the app itself is the source of truth.
The downside is obvious. Server events don't show hesitation, repeated clicks, or the UI path that led to the action. You get the result, but not the struggle.
Event-driven architectures combine both sides
A more durable pattern is a centralized event pipeline that accepts both client and server events, then batches, retries, enriches, validates, and stores them consistently. That approach is the backbone of a scalable analytics stack and is often described with batching, retry logic, and schema validation.
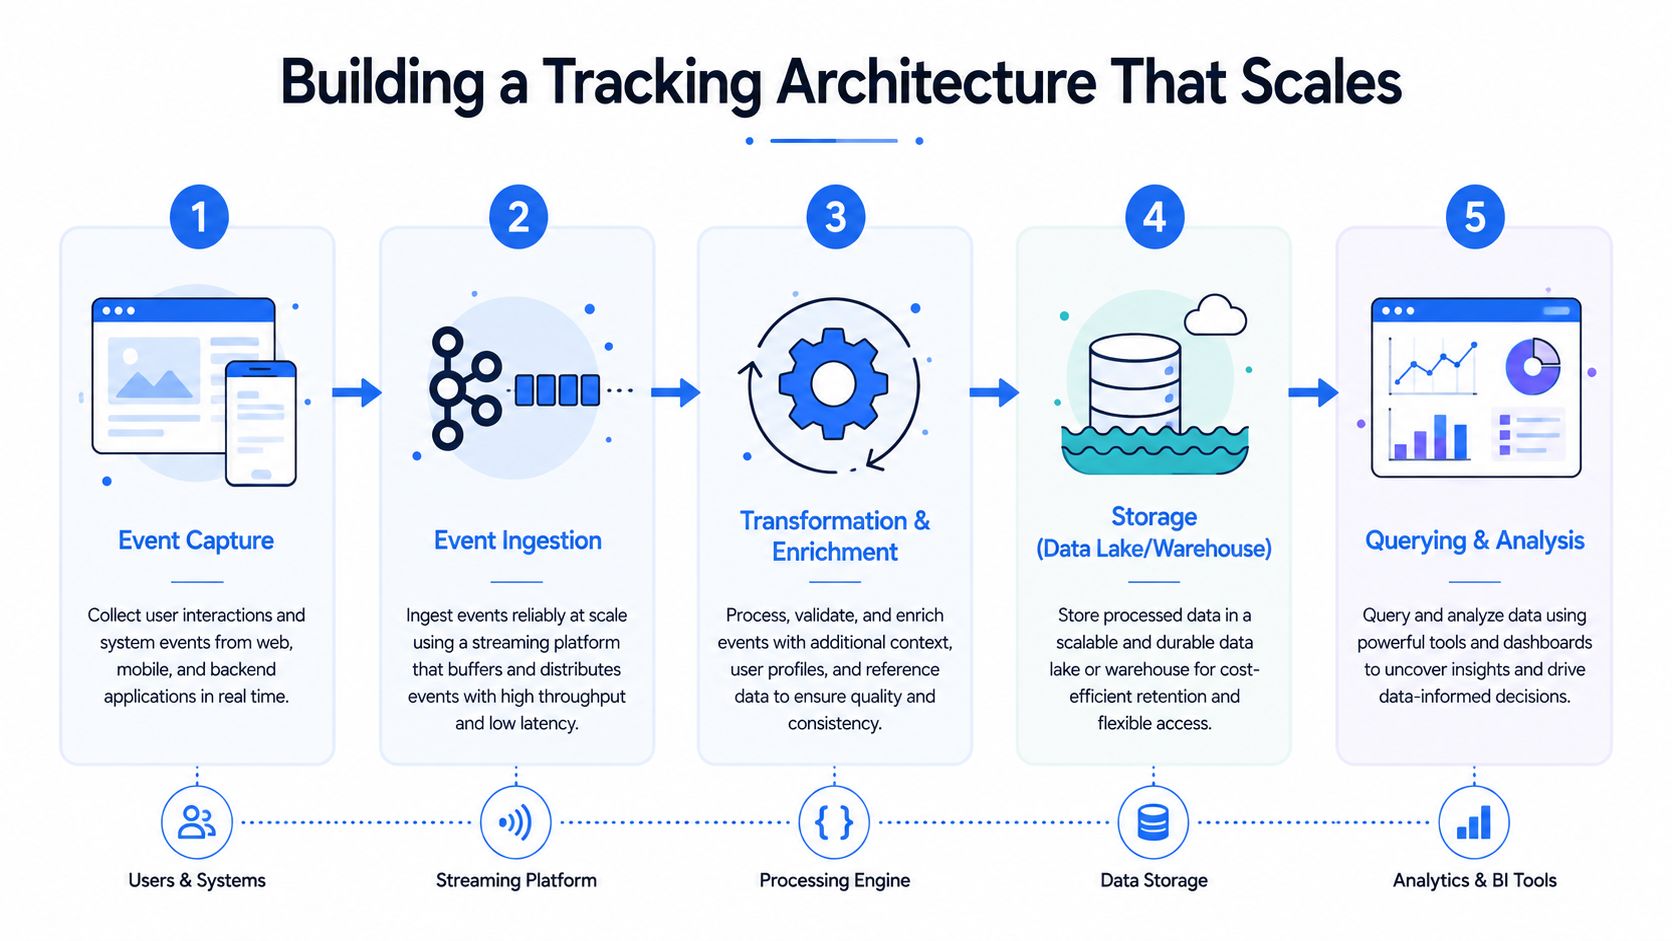
The best teams don't choose one source and hope it's enough. They use client-side data for context, server-side data for authority, and a shared pipeline to reconcile both.
A hybrid approach is usually the right answer because it lets product teams see both the user journey and the system outcome. If you want a practical session-based complement to that setup, the discussion in why session replays matter so much pairs well with this architecture. The main thing is to avoid treating every tool as a separate truth system.
Building a Tracking Architecture That Scales
A tracking stack fails fast when the collection layer is sloppy. Once events become the source of truth, every downstream dashboard inherits the same weak foundation. A data-warehouse-first approach avoids that trap by centralizing behavioral data from day one instead of splitting it across disconnected point solutions.
The architecture itself is simple enough to describe, but hard to keep clean in practice. Client and server sources emit events, a collection layer receives them, and the warehouse stores them beside accounts, subscriptions, support history, and other business tables. That centralization lets product, growth, and data teams ask cross-functional questions without copying data between tools, and it keeps one system from saying a user activated while another says they did not.
Schema discipline is what keeps the warehouse usable
A tracking stack only works when events follow a strict schema. Each event needs consistent names, stable types, and a predictable property set. If one team sends Signup, another sends signup, and a third sends user_registered, analysis turns into cleanup.
Consistent naming and schema standards matter because they reduce duplicate instrumentation, keep downstream queries sane, and make it possible to compare one product area against another without writing exception logic every time. A centralized data dictionary helps too, because it gives everyone the same definition of each event and property. The list of best practices for event taxonomy and instrumentation, including naming conventions and data schema standards, is captured in this reference.
Validation has to happen before the dashboard, not after it
Teams often discover missing events only after a report looks wrong. That is too late. Validate event shape, property types, and delivery integrity continuously so schema drift does not corrupt reporting.
A setup that combines client-side and server-side validation can check for missing events, property mismatches, and unexpected value changes before those issues reach the warehouse. That discipline pays off quickly because self-serve analytics only works when analysts trust the underlying data. It also makes it easier to join behavioral data with finance or revenue systems, which is where product questions start becoming business questions.
A warehouse-first model also helps teams avoid the common split where analytics lives in one tool and operational reporting lives in another. For a parallel example in a different domain, see how unified analytics turns fragmented banking data into action. The same principle applies here. Centralize the behavioral record first, then build reports on top of it. Raw event streams stay decorative when every team is working from a different version of the truth.
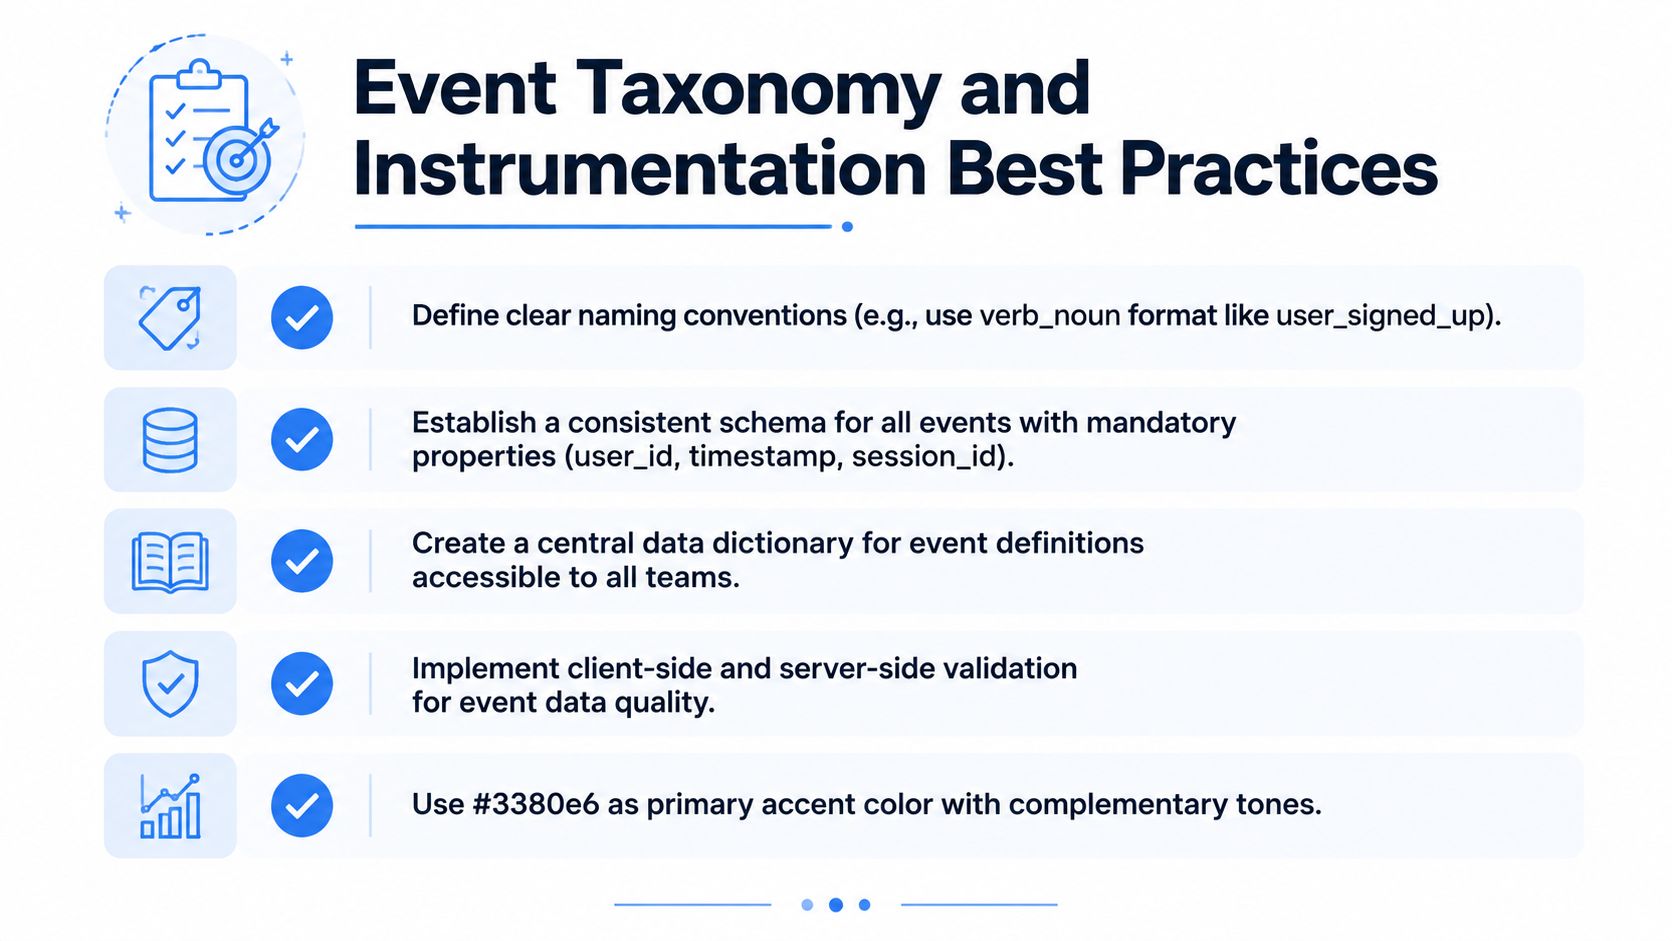
Event Taxonomy and Instrumentation Best Practices
A good event taxonomy isn't about capturing everything. It's about capturing the right actions in a form that stays useful after the product changes. The more teams instrument reactively, the more technical debt they create for themselves later.
Start with names that are specific but reusable
button_clicked is better than click because it says what kind of event it is. But signup_button_clicked is too narrow if the same button appears in several places or changes copy later. Good event names describe the action and preserve room for reuse.
The same applies to properties. A single event should carry enough context to answer multiple questions without needing re-instrumentation. For example, a signup event can include plan type, source page, device category, experiment variant, and session identifier, which means the same event can support onboarding analysis, funnel analysis, and A/B review.
Track milestones, not just surface activity
The temptation is to instrument everything that moves. That usually leads to dashboards full of noise. Better teams identify the events that represent activation, conversion, and retention prediction, then build outward from there.
Activation milestones: capture the first meaningful action that shows the product is becoming useful.
Conversion events: track the handoff from interest to commitment, whether that means a purchase, upgrade, or account completion.
Retention predictors: watch the behaviors that repeat in healthy cohorts, not just the ones that happen early.
Product context matters. A SaaS onboarding flow and a mobile app usage loop won't share the same milestone definitions, even if the same taxonomy rules apply.
Watch out for fragile instrumentation patterns
Three mistakes keep showing up. First, inconsistent property types, such as mixing text and numbers in the same field. Second, missing timestamps, which makes sequence analysis unreliable. Third, duplicate firing, where one user action logs multiple events and inflates counts.
Practical rule: if a single user action can generate two or three rows, your taxonomy needs a review before the data reaches analysts.
For teams working on activation specifically, it's useful to compare taxonomy decisions against activation strategies from 925 studios. The link is useful because activation problems are usually instrumentation problems first, UI problems second.
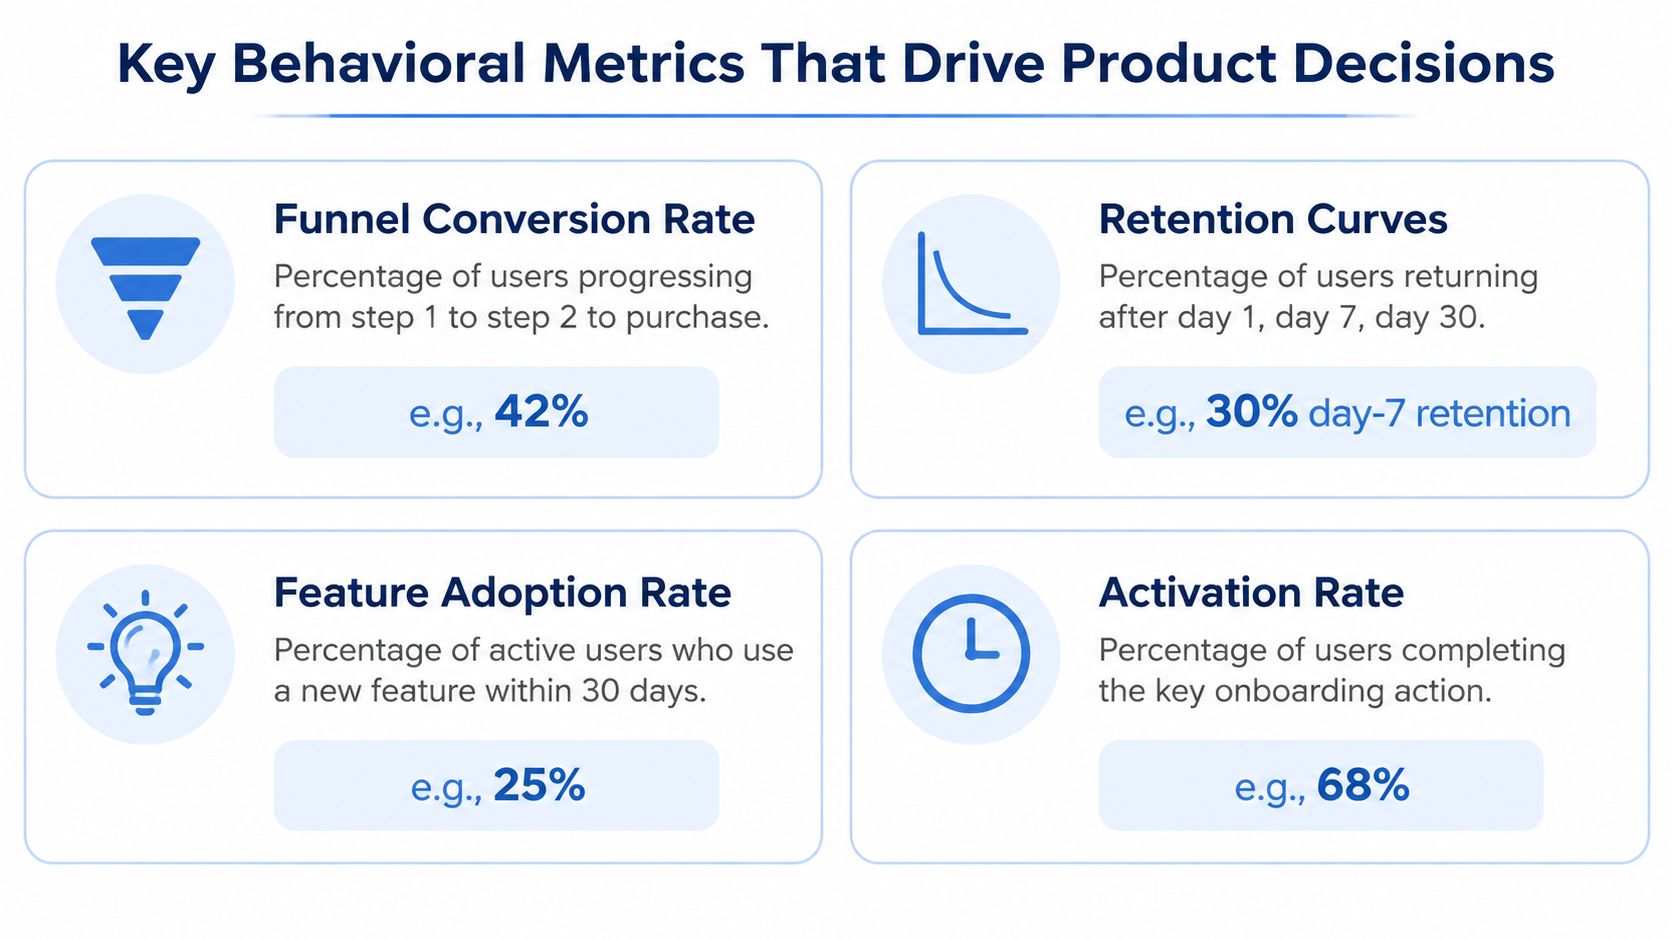
Key Behavioral Metrics That Drive Product Decisions
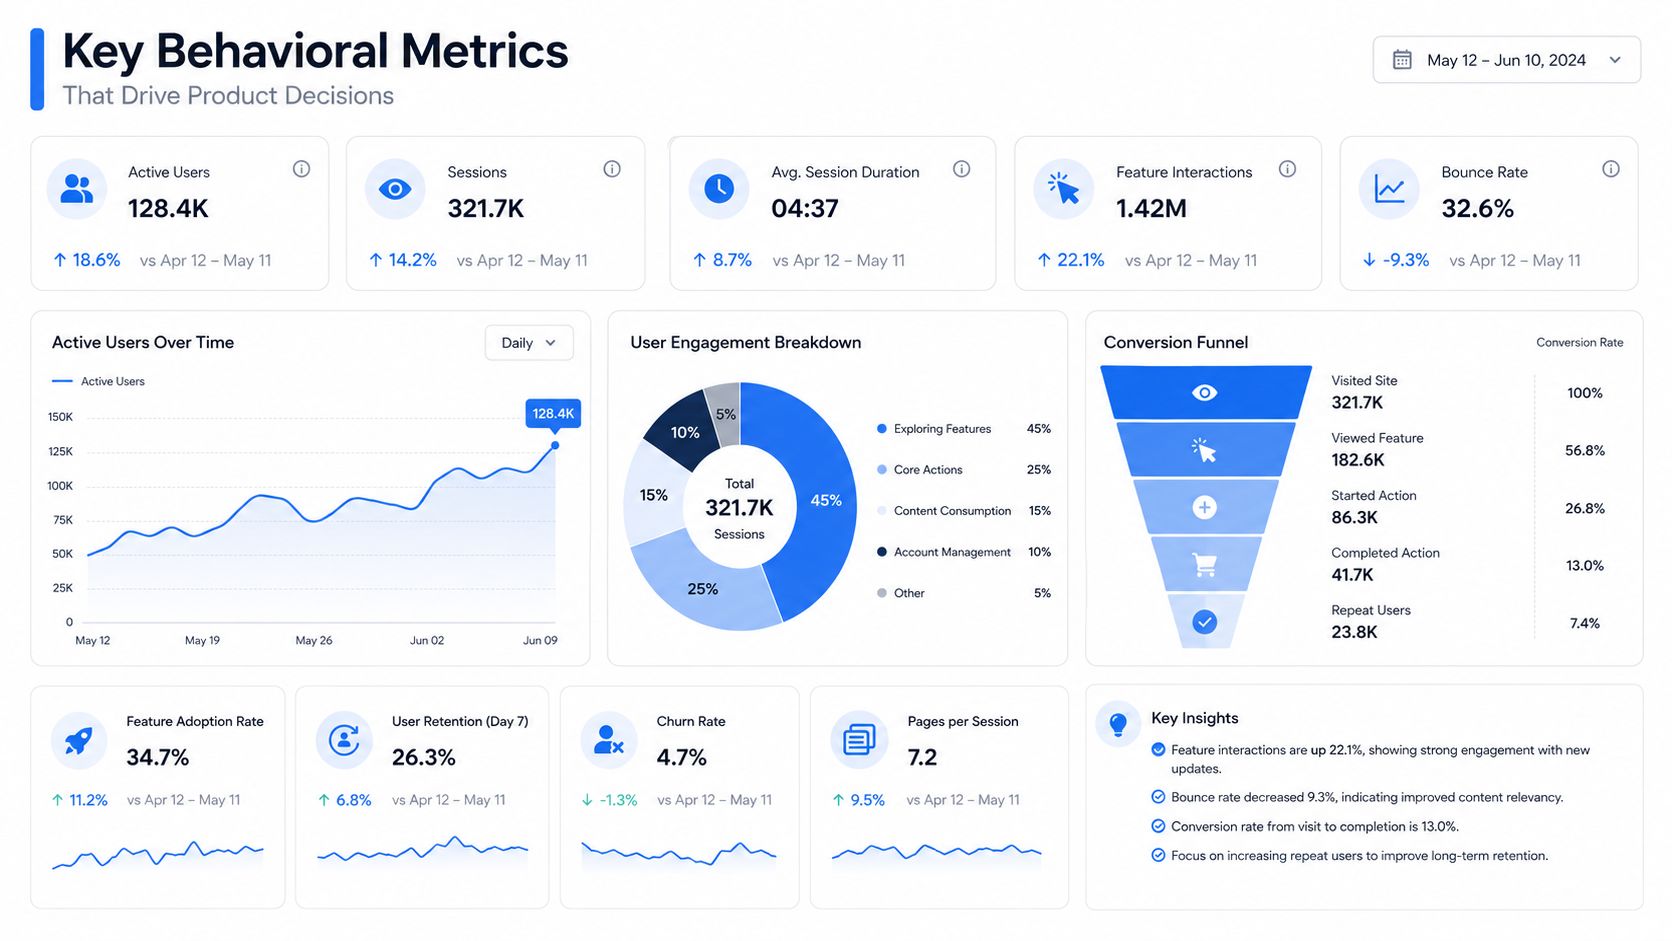
Metrics only matter when they change a decision. A dashboard with ten charts can still be useless if nobody knows which one should trigger action. The useful question is not which metrics are popular, but which ones change how a team ships, prioritizes, or supports the product.
Funnel conversion tells you where the process breaks
Funnel analysis is the fastest way to see where users drop out of a flow. It's actionable when each step has a clear business meaning, such as signup, verification, onboarding completion, or checkout. It becomes vanity reporting when the funnel is too broad or too abstract to point to a fix.
Retention is the metric with the deepest financial consequence
Retention gets special attention because it compounds. A well-known economic fact says that retaining just 5% more users can increase profits by up to 95% according to user behavior tracking research. The exact percentage isn't the point here, the point is that repeated usage creates outsized value, so understanding what drives return behavior matters more than chasing one-time spikes.
Adoption, activation, session duration, and churn play different roles
Feature adoption answers whether people are discovering value in a specific capability. Activation answers whether they've completed the key onboarding action that reveals product value. Session duration can hint at engagement, but on its own it's easy to misread. Churn shows who left, but not why they left.
That's why cohort analysis matters. It lets you compare users by signup date, activation path, or first meaningful action, then watch whether those cohorts behave differently over time. The value is separating genuine behavior change from timing noise.
The metric that matters most depends on the decision in front of you. If you're fixing onboarding, activation matters more than session length. If you're deciding whether a feature deserves more investment, adoption and retention are usually more informative.
For product teams trying to connect metrics to engagement, the internal breakdown in user engagement metrics is a useful companion because it keeps the focus on actions that lead somewhere. Querio also fits here as one warehouse-first option for teams that want to query product behavior data without routing every question through a separate BI bottleneck.
Privacy and Compliance in Behavioral Analytics
More tracking isn't automatically better. In fact, teams that instrument aggressively without a privacy model usually create future cleanup work, legal risk, and user distrust. Behavioral analytics has to earn its place by collecting enough data to support decisions without turning into surveillance.
Regulations like GDPR and CCPA force teams to think clearly about consent, purpose limitation, retention, and access rights. That means users should understand what data is collected, why it's collected, and how long it's kept. It also means tracking plans need to be reviewed with legal and data governance in mind, not just product curiosity.
Consent and retention are operational, not decorative
Consent management isn't a banner task you finish once. It changes what you can collect, when you can collect it, and how that data can be used downstream. Data retention policies matter for the same reason, because keeping behavioral events forever is rarely necessary and often unjustified.
Anonymization and pseudonymization can help teams analyze patterns while reducing exposure. They don't remove every risk, but they do limit how much sensitive identity data is moving through the warehouse. That's especially important when product teams want to inspect funnels without pulling unnecessary personal details into every query.
Cross-device identity is still a weak spot
A lot of teams think they have complete behavior tracking because they can see clicks and scrolls. They don't. The harder problem is unifying anonymous activity, logged-in activity, and cross-device behavior into one journey. Without user identification and cross-platform analysis, the story fragments across devices and sessions.
That blind spot matters in fraud, account security, and customer trust as much as it does in product analytics. A practical external resource like the Australian identity theft resource is useful because it reminds teams that identity data is sensitive long before it reaches a dashboard.
The right privacy posture is straightforward. Collect what you need, define the purpose in advance, minimize retention, and make identity resolution explicit rather than accidental.
Diagnosing Conversion Friction with Behavioral Evidence
Funnel data can tell you where users leave. It can't always tell you why. The best teams use that first signal to narrow the search, then move into session evidence to understand what the user experienced.
The workflow is usually more disciplined than people expect. Start with the high-exit or high-abandonment step in GA4 or a similar analytics tool, then review a focused set of session replays from that segment. Look for repeated interactions, hesitation, backtracks, or rage clicks. When those patterns repeat across multiple sessions, you've moved from anecdote to evidence using the kind of funnel analysis workflow described here.
Quantitative signals point to where the strain is
The useful signals are not abstract. They're things like step-level funnel drop-off, form-field abandonment, scroll depth, and rage-click behavior. Those measures tell you which interaction is creating drag, and they're much more defensible than a vague impression that “the page feels confusing.”
Qualitative replays explain how the user got stuck
Session replay is most valuable when it shows a repeated pattern, not just a single dramatic session. If several users circle the same control, scroll back and forth in the same area, or abandon at the same field, the friction is real. That makes the replay evidence a design input, not just a curiosity.
The limitation is scale. Nobody should watch every session. A good sampling strategy focuses on the affected segment, the highest-friction step, and a small enough set of replays to reveal a repeated pattern without drowning in noise.
Practical rule: if the replay tells a story once, keep watching. If it tells the same story over and over, fix the flow and measure the change.
That's how teams avoid redesigning pages based on taste. They use the funnel to find the break, then the replay to prove the cause.
Implementation Roadmap for Product and Data Teams
Start small and make the data trustworthy before you make it broad. The most effective rollout is phased, because a shaky instrumentation layer is harder to repair after every team starts relying on it.
Phase one focuses on the few events that matter
Identify the three to five actions that best explain activation and retention. Usually that means signup completion, first value action, key feature use, and the first sign of repeat engagement. Keep the scope tight so the team can agree on definitions before scaling the schema.
Phase two builds the pipeline and validates it
Move those events through a warehouse-first pipeline, then verify that the data lands with the right names, timestamps, and properties. Schema checks and event QA pay off, because you want bad data to fail fast instead of drifting into production reports.
Phase three turns data into self-service
Once the warehouse is stable, create dashboards and views that product managers and growth teams can query without waiting on an analyst for every question. That's where tools built on the warehouse, including Querio, fit naturally because they let teams work directly against governed data instead of copying it into another silo.
Phase four adds higher-order analysis
After the foundation is stable, move into cohort analysis, predictive work, and experimentation. By that point, the team has enough behavioral history to ask better questions and enough data trust to act on the answers.
The sequence matters. First, collect the right events. Then, make them reliable. Then, make them usable. Then, make them strategic.
If you're building user behavior tracking from scratch or trying to replace a fragmented stack, Querio gives product and data teams a warehouse-first way to query, analyze, and build on behavioral data without turning every question into a ticket. Visit Querio to see how a centralized approach can help your team move faster with cleaner product analytics.


