What Is Agentic Analytics? a Guide for Data Teams
Learn what is agentic analytics, how it works with AI agents on data warehouses, and why it's replacing traditional BI for faster, self-serve insights.
https://www.youtube.com/watch?v=1tYd4xPPglY
published
Outrank AI
agentic analytics, ai agents, data analytics, self-serve bi, querio
9a7fc241-a139-4c51-876c-e484e0fdbbda

Most data teams know the pattern. A product manager wants to know why activation slipped in one segment. Finance needs a one-off breakdown before the board deck. Operations asks for a daily exception report that somehow turns into a permanent workflow. The warehouse is full, the BI stack is mature, and the team still spends its week answering variations of “can you pull this for me?”
That's the backdrop for what is agentic analytics. It isn't just a new interface on top of SQL. It's a change in how a company consumes data. Instead of routing every meaningful question through analysts, the company starts building an analytics system that can interpret goals, run multi-step analysis, explain findings, and sometimes trigger the next action.
For data teams, that changes the job. You stop acting like a human API for the warehouse. You start maintaining the context, controls, and workflows that let an autonomous system answer questions safely.
Table of Contents
The End of the Endless Data Queue
The endless queue usually doesn't look dramatic. It looks normal. A Slack channel fills with questions. A Jira board collects “small” reporting requests. Analysts spend half the week rewriting the same business logic for different stakeholders because each question arrives with a slightly different filter, date range, or definition.
Traditional BI tools helped with visibility, but they didn't remove the queue. Dashboards answer the questions someone predicted in advance. They don't handle the messy follow-up that comes next. “Why did this metric move?” “Is it isolated to one customer group?” “Did the pricing test affect it?” That work still falls back to a human.
That's why agentic analytics matters. It's less useful to think of it as one more analytics feature and more useful to treat it as a new operating model. Databricks describes agentic analytics as a continuous multi-step reasoning loop that ingests data, analyzes patterns, explains findings, recommends actions, and can trigger workflows automatically. That shift is landing inside a fast-growing market. One projection cited by Databricks estimates the global agentic AI market will rise from $5.25 billion in 2024 to $199.05 billion by 2034, a projected 43.84% CAGR over the period, which points to a move from experimentation to core enterprise architecture for autonomous monitoring and decision-making, as outlined in Databricks' explanation of agentic analytics.
Why the old model breaks down
A dashboard-first setup assumes the main challenge is presentation. It assumes the hard part is putting charts in front of users. In practice, the hard part is interpretation, follow-up, and action.
When a revenue chart dips, nobody really wants the chart. They want the diagnosis. They want someone to test possible causes, compare segments, inspect related systems, and say what changed. Data teams end up doing that manually, over and over.
Practical rule: If your team spends more time translating business questions into query steps than improving the data model itself, you don't have a reporting problem. You have an operating model problem.
What changes with agentic analytics
In an agentic setup, the business user starts with a goal, not a dashboard path. The system can take an ambiguous request and work through the steps that an analyst would usually perform behind the scenes. That's why the shift from static reporting to conversational exploration matters so much. A useful framing appears in this look at the move from dashboards to dialogue in BI, where the interface changes because the workflow underneath changes.
The important consequence for data teams is organizational, not cosmetic. Your value moves upstream. You spend less time serving each individual question and more time maintaining the environment that makes good answers possible.
The Core Architecture of Agentic Analytics
The easiest way to understand an agentic system is to picture a junior analyst who never gets tired, can use several tools in sequence, and can explain its work. That analyst still needs access, definitions, guardrails, and review. But once those exist, it can do far more than return a single query result.
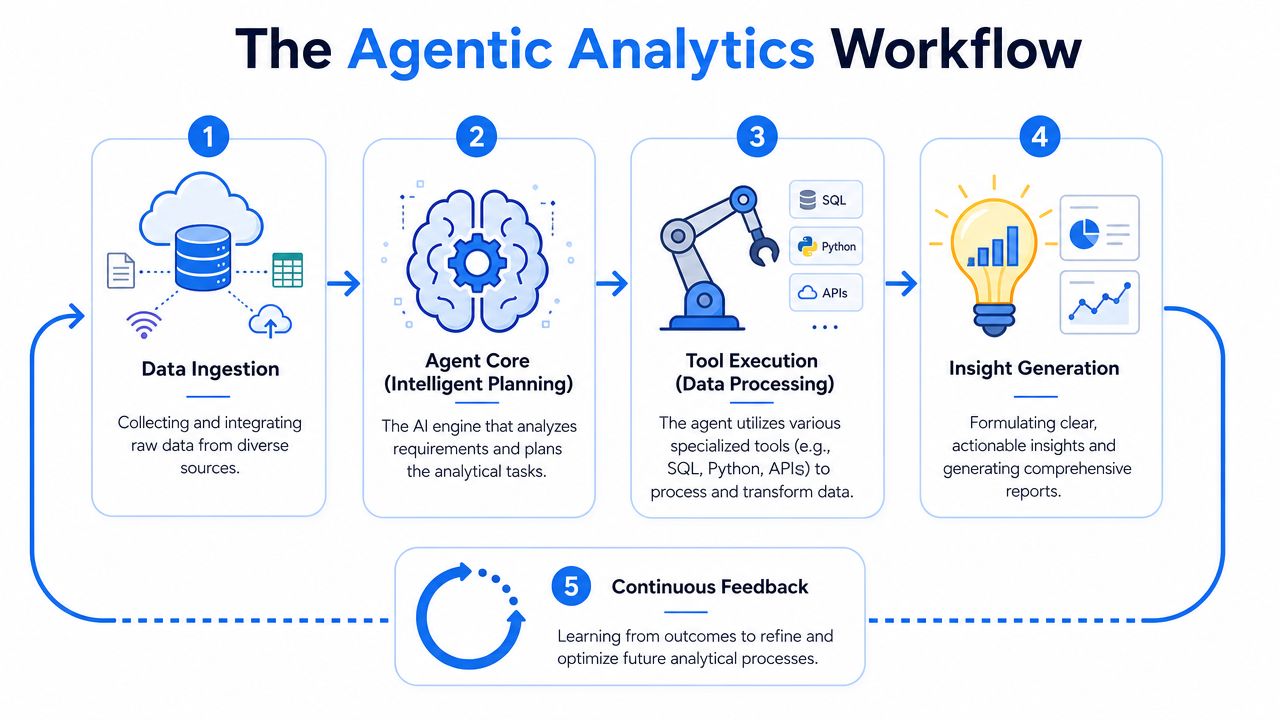
Agentic analytics is technically distinct from BI because it uses LLM-driven agents with tool use and adaptive reasoning to execute multi-step workflows end to end. The system doesn't just query data. It plans and iterates like an analyst, decomposing ambiguous questions into concrete tasks. That requires separate layers for data access, reasoning, and validation, as described in Alteryx's glossary entry on agentic analytics.
Why a chat box is not enough
A lot of teams see a natural-language interface and assume they're looking at agentic analytics. Usually they're looking at a text-to-SQL wrapper.
That distinction matters. A simple interface can translate “show revenue by region last month” into a query. It usually struggles when the request is open-ended, underspecified, or requires several passes through the data. “Why are enterprise renewals soft in EMEA?” is not a single query problem. It's a workflow problem.
The agent has to do things in order:
Interpret the goal and decide what “renewals,” “soft,” and “EMEA” mean in your environment.
Select the right tools such as SQL, Python, or an API call.
Run intermediate checks so it doesn't stop at the first plausible answer.
Validate the output against definitions, history, and constraints.
Return a conclusion that a business user can act on.
This is similar to how search and content systems need structured context before AI can work reliably. Wispra's insights on AI understanding are useful here because they show the same core principle in another domain. AI doesn't “understand” by magic. It performs better when the underlying structure is explicit and machine-readable.
How the workflow actually runs
In practice, a strong architecture usually includes these parts:
A governed query layer: The agent needs direct, permission-aware access to warehouse data and approved sources.
A reasoning layer: In this layer, the model breaks a question into steps, chooses tools, and adjusts course.
Execution tools: SQL execution, notebook code, API calls, and sometimes workflow connectors.
Validation logic: The agent checks whether the answer is complete, contradictory, or based on the wrong grain.
Traceability: Teams need to inspect what the system did, not just read the final answer.
A good agent doesn't hide its reasoning path from the data team. It exposes enough of the workflow that you can audit it, improve it, and decide where human approval belongs.
If you're evaluating platforms, the most important question isn't whether the demo can answer a prompt. It's whether the system has a durable query and execution layer under that prompt. That's the difference between a toy and infrastructure, and it's also why teams spend so much time on what makes a good AI query layer over your database.
Agentic Analytics vs Traditional BI Tools
The cleanest way to answer what is agentic analytics is to compare it with the stack many organizations typically use. Tools like Looker and Tableau are built around pre-modeled views, dashboards, and governed reporting. They're good at giving teams a shared pulse on the business. They're weaker when the user's real question hasn't already been modeled into a chart.
First-generation natural-language tools improved access, but many of them still behaved like search over dashboards or text-to-SQL over a narrow schema. Agentic systems go further. They're designed to handle ambiguity, perform multiple analytical steps, and synthesize an answer instead of only returning a chart.
The practical difference in day-to-day work
Traditional BI is mostly reactive. Someone builds a view. A stakeholder reads it. A follow-up question appears. Then an analyst steps in.
Agentic analytics is more interactive and more procedural. The user starts with an objective or investigation. The system can branch, test, refine, and return a reasoned answer. In mature setups, it can also suggest or trigger a downstream workflow.
Attribute | Traditional BI (e.g., Looker, Tableau) | Agentic Analytics (e.g., Querio) |
|---|---|---|
User interface | Dashboards, charts, metric explorers | Conversational interface, notebook-style workflows, inspectable analysis |
Typical question type | Pre-defined and recurring | Ambiguous, exploratory, multi-step |
Workflow owner | Human-led | Agent-led with human oversight |
Primary output | Visualization or saved report | Synthesized answer, supporting analysis, and sometimes recommended action |
Best at | Monitoring stable KPIs | Investigating why something changed and what to do next |
Main constraint | Requires upfront modeling of likely questions | Requires strong governance and context to stay trustworthy |
Where each approach still fits
This isn't a replacement story where dashboards disappear. Dashboards still matter because they're fast to scan and useful for shared operational review. Nobody wants to ask an agent for the same executive scorecard every morning if a clean dashboard already exists.
What changes is the boundary line between static visibility and active investigation.
A practical split looks like this:
Use traditional BI for stable reporting: Board metrics, weekly reviews, finance packs, and tightly governed definitions.
Use agentic analytics for the long tail of questions: Root-cause analysis, ad hoc segmentation, unexplained anomalies, and cross-functional follow-up.
Keep humans in the loop for judgment-heavy decisions: The system can narrow the search space, but leaders still own trade-offs.
The mistake is treating agentic analytics like a prettier dashboard tool. It's closer to an analytical operator that can work through a problem. That's why the implementation burden lands on governance and workflow design, not just interface design.
Why This Is the Future of Data Work
The strongest signal here isn't vendor messaging. It's adoption. A 2026 compilation reports that 79% of organizations say they have some level of AI agent adoption, and 96% plan to expand their use. The same source reports average ROI of 171%, with U.S. enterprises around 192%, which it says is roughly 3x traditional automation ROI. Those figures suggest that the move toward autonomous systems is already underway, as summarized in Landbase's collection of agentic AI statistics.
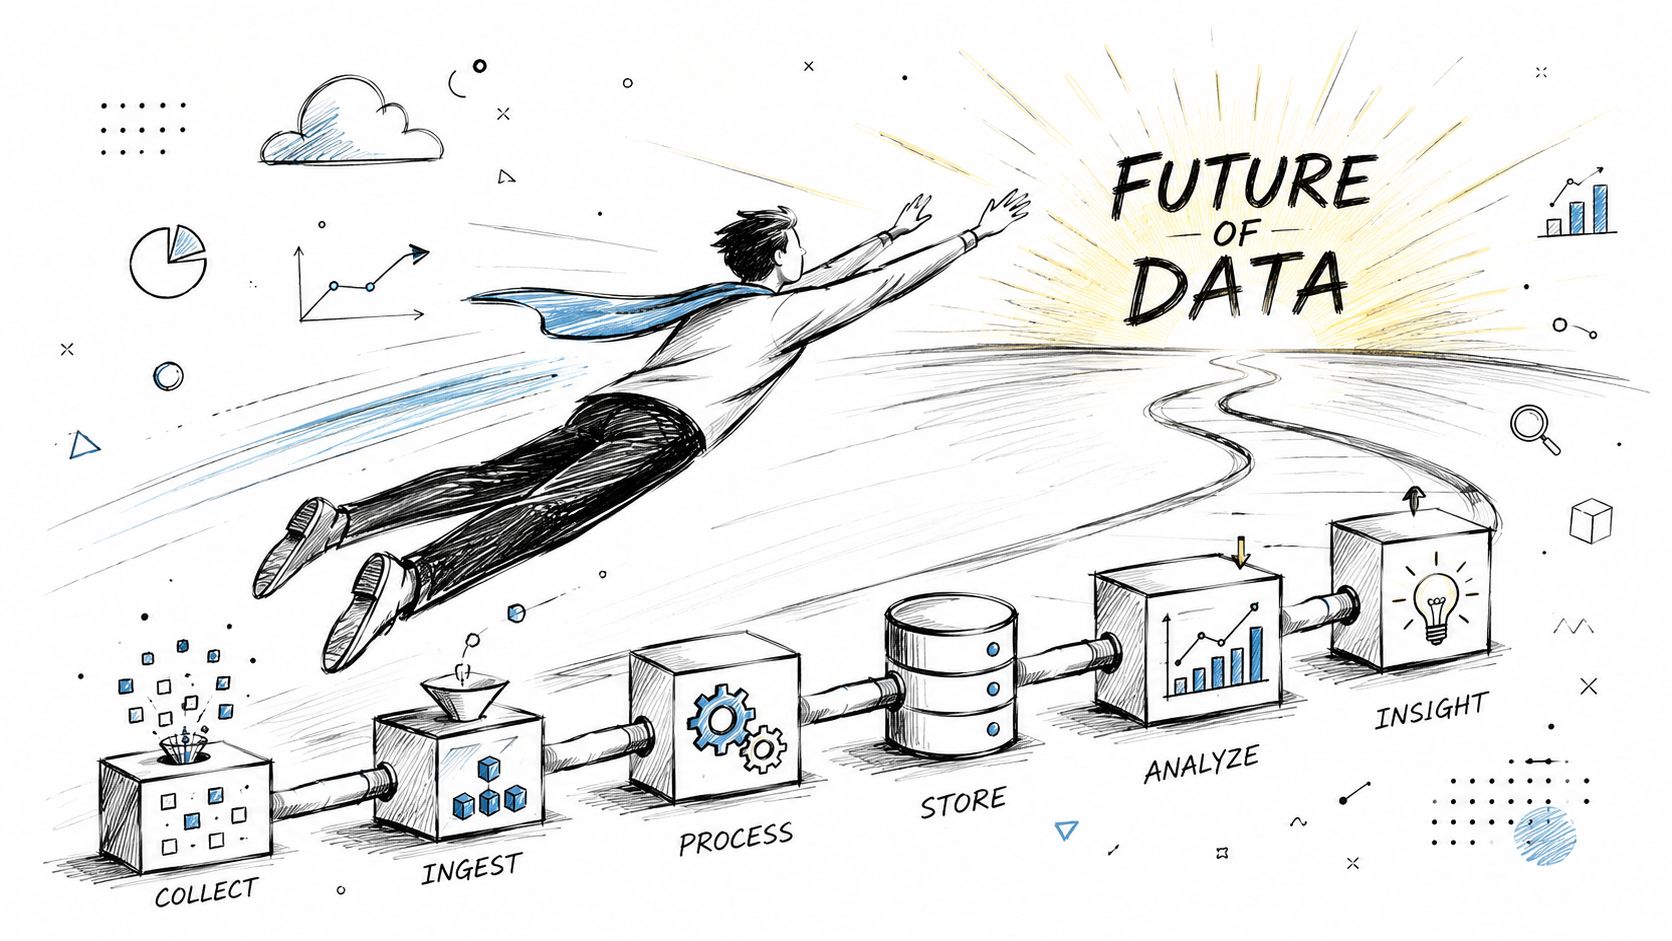
The practical meaning for a data organization is straightforward. If more of the business can ask questions directly and get usable answers, the data team doesn't vanish. Its center of gravity shifts. The team spends less energy hand-carrying requests and more energy maintaining a reliable analytics system.
The team role changes first
That role shift usually happens before the tooling is fully mature. Analysts and analytics engineers become maintainers of context, semantics, access rules, and evaluation standards. They decide which models are trusted, which metrics are canonical, which actions require approval, and where the agent is allowed to operate.
That's a better use of expensive talent.
Instead of writing the tenth variation of the same retention query, a senior analyst can define the metric once, inspect how the agent uses it, and improve the system for every future request. The work becomes more infrastructural and more scalable. This is one reason the discussion around how large language models are transforming data teams has moved beyond productivity tricks and into team design.
Operational takeaway: The future data team isn't a queue manager. It's a reliability team for autonomous analytics.
What leaders should expect
Leaders should expect both relief and friction.
The relief is obvious. Product, finance, operations, and leadership teams can get faster answers without waiting in line. Data specialists can focus on modeling, governance, and complex analysis that requires judgment.
The friction is also real. Agents expose weak definitions, duplicate tables, unclear ownership, and inconsistent access policies very quickly. A human analyst can route around messy context because they know the company. An agent can't do that safely unless you've encoded the context somewhere.
A short discussion of the operating shift helps here:
Teams that do well with agentic analytics usually accept this early. They don't ask, “How do we make the agent sound smart?” They ask, “What would this system need to know to be reliably useful?”
Practical Use Cases for Agentic Systems
The easiest way to make agentic analytics concrete is to follow the request path. Not the feature list. The interesting part is how the system handles messy, cross-functional questions that would normally trigger several back-and-forth cycles with the data team.
Product teams chasing a retention drop
A product manager asks, “Why did user retention dip last week in our European segment?”
A dashboard can confirm the dip. It might even break the trend out by country or device. But the real work starts after that. An agentic system can inspect the relevant time window, compare retention by acquisition source, app version, plan type, and onboarding path, then check whether a release or experiment coincided with the change.
A useful response doesn't just list cuts of the data. It narrows likely causes. It might identify that the decline is concentrated in a recent signup cohort, tied to one onboarding step, and isolated to a mobile release. That gives the PM something to investigate with engineering immediately.
When the system is working well, the first answer is not “retention is down.” It's “the decline is concentrated here, started at this point, and appears related to these changes.”
Operations teams monitoring moving targets
Operations leads often need persistent monitoring, not one-off analysis. They care about whether a system can watch costs, volumes, exceptions, and vendor behavior without waiting for someone to remember to check.
An agent can continuously monitor shipping costs, identify unusual supplier changes, compare them against recent baselines, and surface a summary with likely explanations. If connected to downstream systems, it can also draft an alert or route a review task to the right owner.
The operational pattern matters more than the specific metric:
The question is ongoing: “Watch this and tell me when something matters.”
The analysis is comparative: The system has to distinguish routine movement from meaningful deviation.
The output needs routing: Insight without handoff still creates work for humans.
In workflows that produce automated outreach or notifications, surrounding systems matter too. For teams extending agents into external communication, email deliverability tools for AI agents become relevant because the analytics layer may identify who should be contacted, but deliverability determines whether those actions land.
Leadership teams asking for synthesis, not charts
Executives rarely want raw query output. They want synthesis. “What are our top three growth drivers this quarter, and what evidence supports them?” is not a dashboard question in the usual sense.
An agentic workflow can gather supporting evidence across product usage, pipeline, conversion behavior, and expansion signals, then assemble a ranked explanation. The value is not that it creates a prettier chart. The value is that it performs the connective tissue work analysts usually do manually before a leadership meeting.
Many BI tools feel rigid. They can display the ingredients. They don't naturally produce a concise analytical narrative from them.
How to Implement Agentic Analytics with Querio
Implementation starts in a less glamorous place than many might expect. Before you choose an interface, choose your ground truth. Agentic analytics only works when the data foundation is governed enough for an autonomous system to reason over it safely.
A critical requirement is a governed data foundation with clear semantic definitions and lineage. Autonomous agents can produce untrustworthy outputs when they reason over ambiguous data. When they operate on structured, enriched data models, they can monitor metrics, explain changes, and execute actions with higher confidence, as explained in Snowplow's guide to agentic analytics.
Start with the data foundation
Most failed pilots follow the same pattern. The model seems capable, but the environment is messy. There are multiple versions of the same metric, lightly documented tables, and permissions that made sense for humans but not for autonomous workflows.
The first implementation checklist is operational:
Define canonical metrics: Revenue, retention, activation, churn, and other core terms need one accepted meaning.
Make lineage visible: Teams need to know where the data came from and which transformations shape it.
Apply role-based access: The agent should inherit the same boundaries you would expect for a human user.
Set approval thresholds: Some outputs can be informational. Others should require review before any action is taken.
Build order matters: governance first, autonomy second.
What implementation looks like in practice
Once that foundation exists, the platform decision becomes clearer. You need a system that can sit close to the warehouse, expose inspectable analysis, and support both technical and non-technical users.
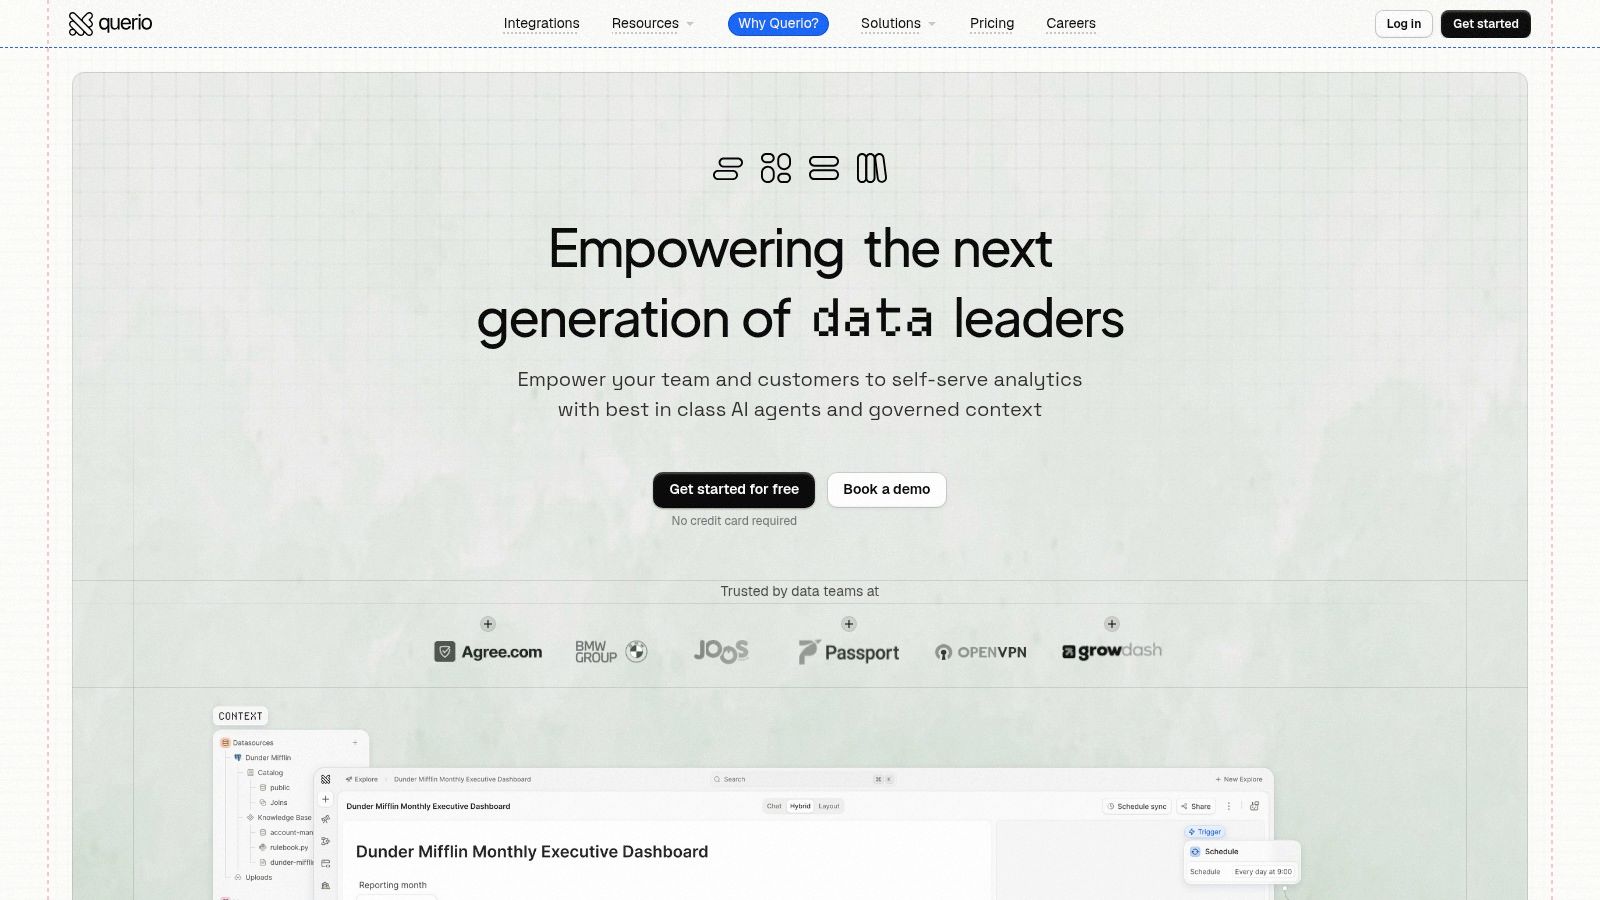
One example is Querio, which deploys AI coding agents directly on the data warehouse and uses a file-system approach with custom notebooks so users can query, analyze, and build on company data without routing every step through analysts. That model is useful when a team wants self-service analytics with inspectable SQL and Python rather than a black-box answer layer. The practical shape of that workflow is similar to what's described in Querio's overview of chatting with BigQuery, Snowflake, and Postgres.
A sensible rollout is usually narrow at first. Start with one analytical workflow that causes recurring load on the data team. Give the agent access to governed data, make the output inspectable, review where it fails, and tighten the semantics before expanding. The goal isn't to automate everything. The goal is to move your team from answering repeated questions by hand to maintaining the system that can answer them reliably.
If your team is overloaded with ad hoc questions and you want to shift from queue-based analytics to governed, warehouse-native autonomous workflows, Querio is one platform to evaluate. It's built for teams that want inspectable AI analysis on top of their existing data warehouse, with notebooks and agentic workflows that reduce the need to act as a human API for every request.

