Business Metrics Definition: A Practical Guide for 2026
A complete business metrics definition guide. Learn to define, choose, and implement metrics for self-serve analytics and avoid common pitfalls.
https://www.youtube.com/watch?v=w0vNgqm_ffY
published
Outrank AI
business metrics definition, kpi vs metric, data-driven decisions, analytics implementation, self-serve bi
56535670-2c86-40b7-9b7c-f7f176dcbbb2

Your leadership team is in a weekly review. Marketing says customer growth is up. Sales says it's flat. Product says activation improved, so growth should be higher than both numbers suggest. Everyone is looking at a dashboard. No one trusts the dashboard.
That's the moment where most founders realize they don't have a reporting problem. They have a business metrics definition problem.
A metric isn't useful because it has a chart. It's useful because everyone agrees on what it means, how it's calculated, what time period it covers, and which decision it should influence. Until that's locked down, “data-driven” is mostly theater. Teams keep arguing about numbers that look precise but are built on different assumptions.
Modern companies feel this more sharply because the stack is more fragmented. CRM data sits in one system, billing in another, product events somewhere else, and spreadsheets still fill the gaps. If your definitions live in people's heads, Slack threads, or one-off SQL queries, the same metric name will drift across teams. That drift becomes expensive fast.
Table of Contents
The High Cost of Vague Numbers
Vague numbers don't just create messy meetings. They slow execution. When teams use the same word for different calculations, leaders stop debating strategy and start debating arithmetic.
A common example is “customer growth.” Marketing may define it as new leads converted to accounts. Sales may use closed-won customers. Product may count activated workspaces. Finance may only count paying customers. Each number can be internally reasonable, and all of them can still be wrong for the conversation at hand.
That gap has a name: metric ambiguity. A 2025 Gartner report discussed in DataHub's business metric guide found that 68% of organizations struggle with metric ambiguity, where teams use the same metric name but define it differently based on disparate data sources, leading to flawed strategic decisions.
Why this gets worse as companies scale
In an early-stage company, ambiguity hides behind speed. The founder asks for a number, someone pulls it from a spreadsheet, and the business moves on. That works until there are more teams, more tools, and more meetings where decisions need to travel across functions.
At that point, inconsistency becomes a strategic liability:
Planning breaks down: Finance forecasts one number while go-to-market teams operate from another.
Trust erodes: People stop asking what the business is doing and start asking whose dashboard is “right.”
Self-serve analytics fails: Non-technical users won't explore data confidently if every metric has hidden caveats.
Data teams become bottlenecks: Analysts spend their time reconciling definitions instead of improving decision quality.
Practical rule: If two smart teams can defend two different versions of the same metric, the metric is not defined well enough.
The mistake is treating this as a technical cleanup task. It isn't. It's a management system issue. A metric definition is part business language, part operational policy, and part implementation detail. If any one of those pieces is missing, the number won't hold up under real use.
Metrics Versus KPIs Decoding the Difference
A lot of confusion starts because people use metric and KPI as if they mean the same thing. They don't, and the distinction matters.
A business metric is a quantifiable measure of performance. It can describe finance, operations, customer behavior, marketing efficiency, product usage, or team output. A KPI is narrower. It's the small subset of metrics tied directly to strategic goals and executive accountability. TechTarget's definition makes that distinction clearly: companies may track many metrics, but only a few are key enough to drive decisions at the leadership level, as explained in this business metric overview.
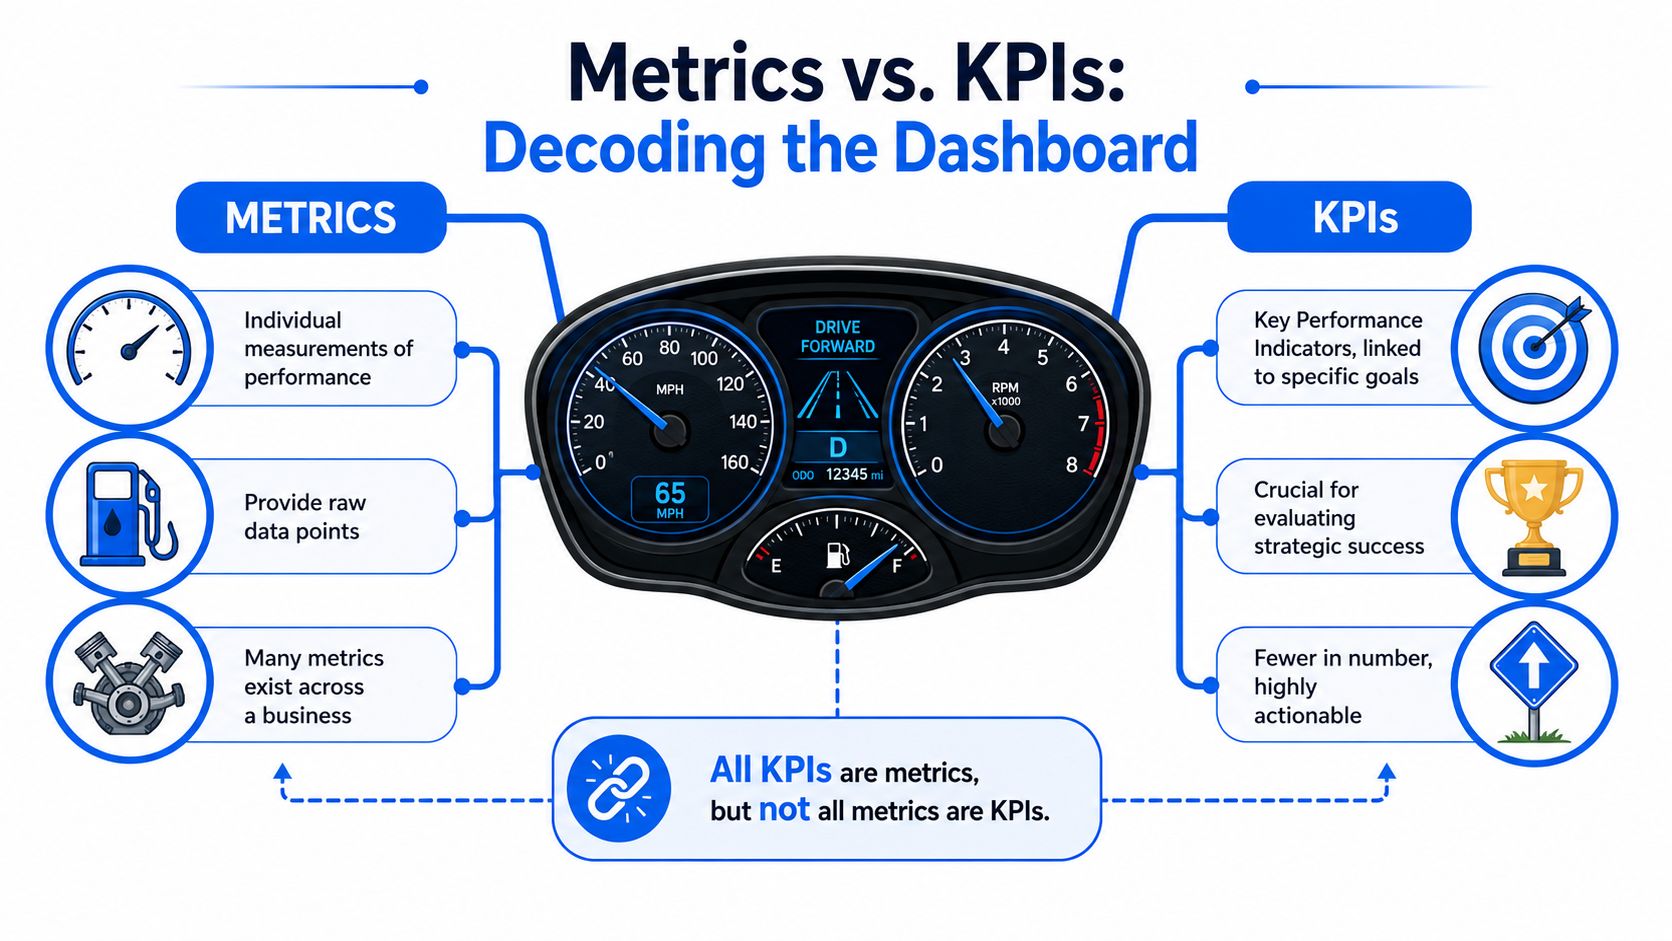
Use the dashboard analogy
Think of your company like a car dashboard.
You have a lot of gauges available. Engine temperature, tire pressure, battery status, RPM, fuel level, and speed all tell you something useful. Those are your metrics. They help you understand how the system is performing.
But if you're driving toward a destination, you won't stare at every gauge equally. You'll care most about speed, fuel, and whether you're on course. Those are your KPIs. They're the measures that determine whether you're achieving the outcome that matters right now.
That hierarchy is simple but important:
All KPIs are metrics
Not all metrics are KPIs
KPIs change with company priorities
Metrics remain useful even when they're not executive-level
What this means in practice
Founders often make one of two mistakes. They either label everything a KPI, which creates noise, or they under-specify KPIs and end up with broad slogans instead of measurable targets.
A healthier approach is to separate your measurement system into layers:
Layer | Purpose | Example |
|---|---|---|
Broad metrics | Monitor functional performance | Customer retention rate, gross profit margin |
Team KPIs | Track a department's current objectives | Trial-to-paid conversion, onboarding completion |
Company KPIs | Reflect the few outcomes leadership reviews constantly | Revenue growth, retention, forecast variance |
A KPI should have consequences. If it moves unexpectedly, someone should investigate and someone should own the response.
If your team needs a clearer framework for deciding what belongs in that top layer, this guide to understanding key performance indicators is a useful complement.
The test is simple: if the number changed sharply tomorrow, would your leadership team change what it does this week? If not, it's probably a metric, not a KPI.
A Practical Categorization of Business Metrics
Most companies don't need more metrics. They need a cleaner way to organize the ones they already have.
The easiest structure is to group metrics by the business question they answer. That keeps teams from mixing operating signals, financial outcomes, and customer behavior into one undifferentiated dashboard. It also helps you assign ownership. Finance should own finance definitions. Product should help define product behavior metrics. Data should make those definitions executable and consistent.
A useful starting point is four categories: financial, customer and product, marketing and sales, and operational.
Common Business Metrics by Category
Common business metrics are often expressed as percentages using standardized formulas, which is why they're comparable across periods and business units. Maxio's business metrics guide gives examples such as revenue growth rate, gross profit margin, and customer retention rate, including the standard gross profit margin formula: ((Total Revenue - COGS) / Total Revenue) * 100.
Category | Metric Example | Formula / Definition |
|---|---|---|
Financial | Revenue growth rate | Revenue change over a defined period, commonly reported as a percentage |
Financial | Gross profit margin | ((Total Revenue - COGS) / Total Revenue) * 100 |
Customer and Product | Customer retention rate | Share of customers retained over a defined period |
Customer and Product | Product activation | Percentage of new users who complete the key activation event you define |
Marketing and Sales | Lead-to-customer conversion | Share of leads that become customers in a defined time window |
Marketing and Sales | Pipeline coverage | Pipeline value relative to booking target, using a definition agreed with sales leadership |
Operational | Forecast variance | Difference between actual and forecast, based on your documented formula |
Operational | Support resolution time | Time taken to resolve customer issues within a defined scope and queue logic |
What belongs in each category
Financial metrics tell you what the business produced in economic terms. Revenue growth rate and gross profit margin are foundational because they translate activity into business outcomes. For subscription companies, recurring revenue metrics often become central, and founders who need a finance-first primer often benefit from an essential guide for founders that explains recurring revenue concepts in plain language.
Customer and product metrics explain whether users are getting value. Retention matters more than acquisition bragging rights if people leave before they realize product value. Activation matters because it often signals whether onboarding and product experience are working.
Don't force one formula across every business
Marketing and sales metrics are where a lot of metric damage happens. Teams inherit definitions from playbooks, CRM defaults, or vendor dashboards, then assume those definitions fit their funnel. They often don't. “Qualified lead” means different things depending on your sales motion. “Conversion” means different things depending on whether you sell monthly, annually, self-serve, or enterprise.
Operational metrics are usually the least glamorous and the most useful. Forecast variance, cycle time, data freshness, and support responsiveness don't always make investor slides, but they determine whether the machine runs cleanly.
A metric category is not just a reporting convenience. It tells you what type of decision the number is supposed to support.
How to Choose the Right Metrics for Your Business
The right metric isn't the one your tool makes easy to display. It's the one that sharpens a business decision.
That's why metric selection should start with goals, not dashboards. If your company is trying to improve retention, then a metric tied to customer behavior after onboarding matters more than a broad top-line growth chart. If the goal is more predictable planning, forecast variance and pipeline quality may matter more than total lead volume.
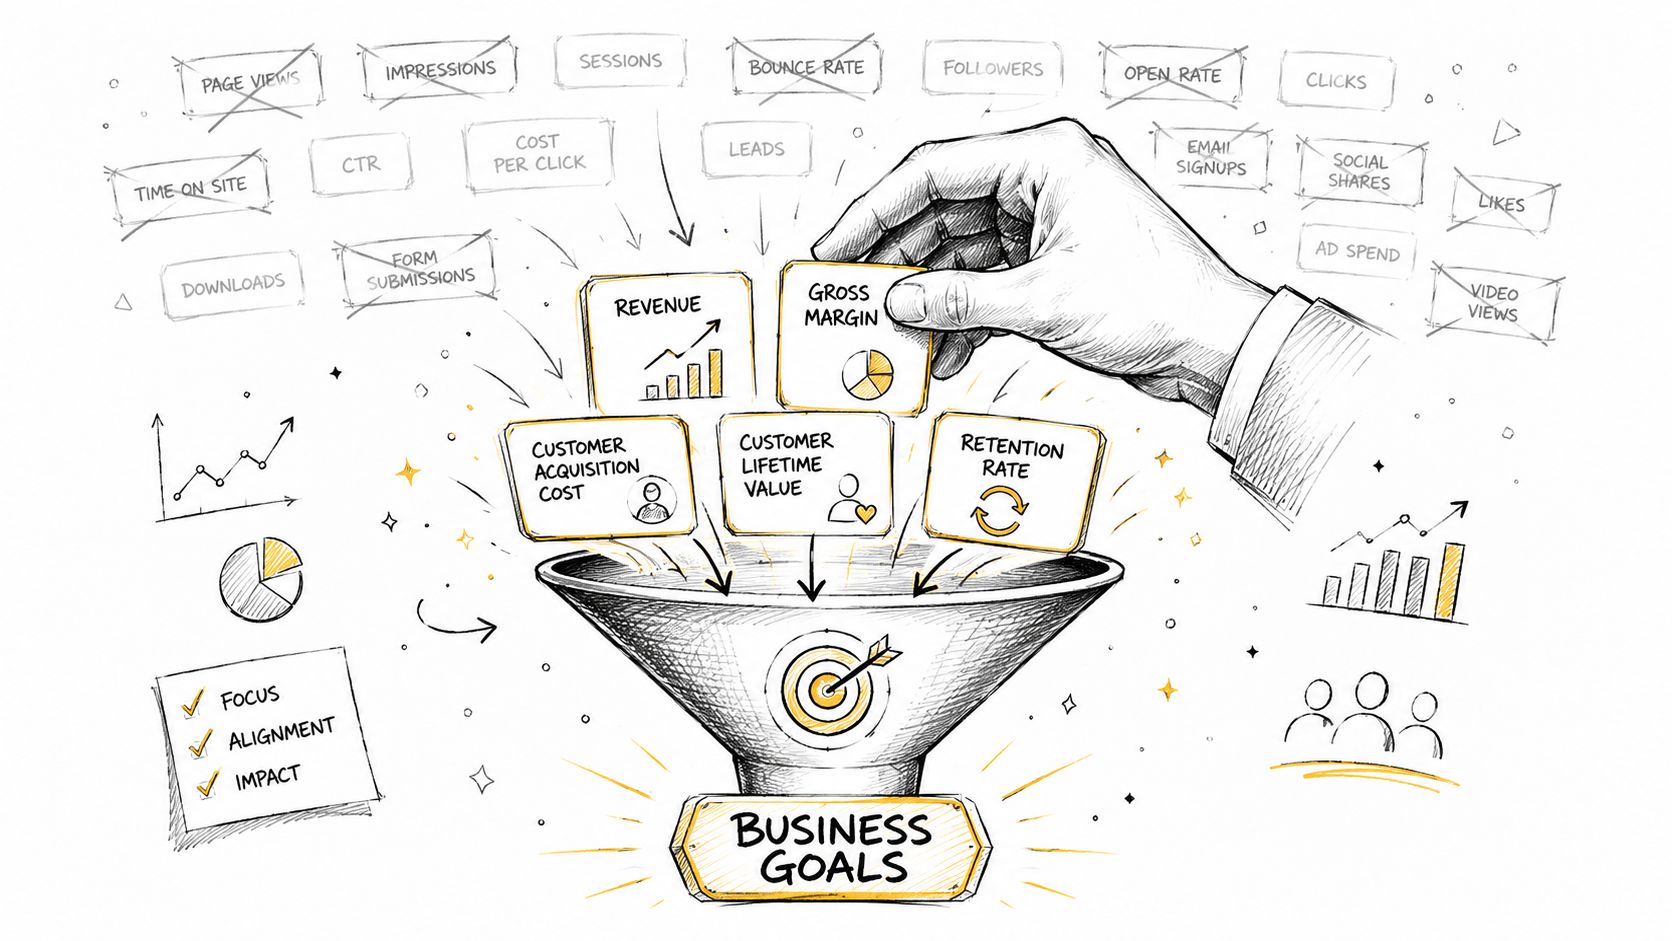
Start with the decision, not the data
A practical selection process looks like this:
Name the objective: Be explicit about the business outcome you want to improve.
Identify the decision owner: Someone needs to be accountable for acting on the number.
Choose one lagging indicator: This tells you whether the outcome happened.
Choose one or two leading indicators: These give you earlier signals that the outcome is moving.
Define thresholds and review cadence: A metric without an action path becomes dashboard wallpaper.
Many teams overlook non-financial metrics. Once revenue reporting is stable, leaders often default to more finance metrics because they feel harder and cleaner. But some of the best predictors of future performance live outside the P&L.
A 2026 Harvard Business Review study referenced in VisionEdge Marketing's summary reported that non-financial metrics outperform financial metrics in predicting future revenue growth by 3.2x over a 12-month horizon.
Build a balanced set
That doesn't mean financial metrics matter less. It means they arrive later. Revenue tells you what happened. Customer satisfaction, employee engagement, product adoption, onboarding completion, and service quality often tell you what's coming.
A good scorecard mixes both:
Lagging metrics: Revenue, margin, retention outcome
Leading metrics: Activation, engagement, satisfaction, sales quality
Control metrics: Forecast variance, process reliability, data freshness
If you want a planning template for matching company goals to a workable metric set, this business metrics planner for growth is worth reviewing.
Strong metric systems help teams act earlier. Weak ones help them explain the past more elegantly.
Implementing Metrics for Self-Serve Analytics
Once you've chosen the right metrics, the hard part begins. You have to make them executable.
Many business metrics definition efforts collapse at this point. The leadership team agrees on language, but the technical implementation stays fragmented across BI tools, SQL queries, spreadsheets, and reverse-engineered dashboards. The result is predictable. Every downstream tool reinterprets the metric slightly differently.
A robust definition needs more than a label. EBSCO describes business metrics as quantifiable, objective criteria tied to a specific business objective in its research starter on business metrics. In practice, that objective has to be translated into warehouse logic that can run the same way every time.
What a usable metric definition needs
Before a metric goes into a self-serve environment, document these pieces:
Business meaning: What business question does this metric answer?
Calculation formula: The exact logic used to compute it.
Time window: Daily, weekly, monthly, trailing, or cohort-based.
Scope rules: Which customers, products, regions, or statuses are included or excluded.
Benchmark source: What it should be compared against.
Owner: Which function approves changes to the definition.
NetSuite's guidance is useful here because it emphasizes formula, time window, and benchmark source as core parts of a strong metric definition. Its example for forecast variance uses the formula ((Actual - Forecast) / Actual) × 100, which illustrates why exact documented logic matters.
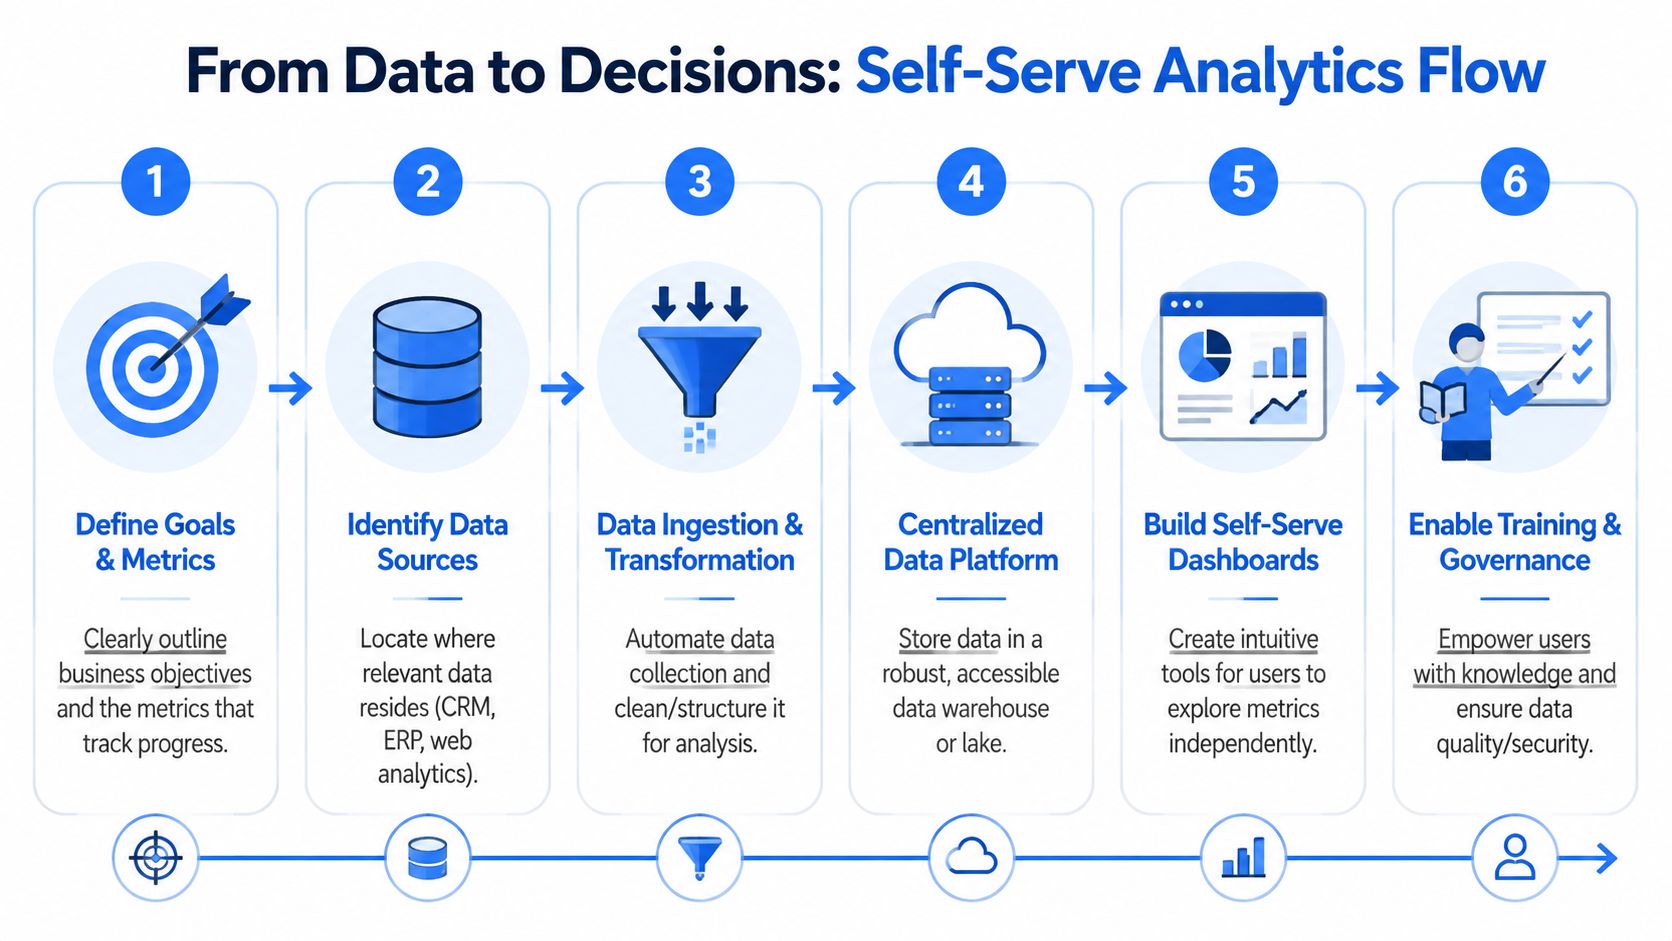
Why spreadsheets and disconnected dashboards fail
Spreadsheets are fine for exploration. They're terrible as a definition layer. The same is true for BI dashboards built independently by different teams. Both approaches encourage local logic. Someone adds a filter, changes a date rule, excludes a segment, or joins to a different source table. Soon the metric name stays the same while the meaning changes.
That's why the warehouse should be the operational center of your metrics system. Raw data lands there. Cleaned and modeled data lives there. And metric definitions should be tied to governed models, not recreated in every front-end tool.
A practical architecture usually includes:
Layer | What it should do |
|---|---|
Source systems | Produce operational data from CRM, billing, product, support |
Data ingestion | Move source data into the warehouse reliably |
Transformation layer | Clean and model tables into business-ready datasets |
Metrics layer | Define reusable metric logic once |
Consumption layer | Dashboards, notebooks, BI tools, and AI interfaces query the same governed logic |
A short walkthrough of that self-serve model is useful here:
Metric lineage is what makes definitions trustworthy
The underappreciated part of business metrics definition is metric lineage. That means tracing a metric back to the tables, transformation logic, filters, and business assumptions that produce it. If you can't answer where a number came from, you don't have a self-serve system. You have a presentation layer.
A centralized metrics layer helps. Some teams implement it through dbt models and documentation. Others use semantic layers or governed notebook-based systems. Querio is one example of a platform built around this approach. It lets teams work on warehouse data through a file-system and notebook model so metric logic can be maintained centrally and used consistently across analysis and dashboards.
If you're evaluating operating models for that setup, this explanation of self-serve business intelligence is a useful reference.
The goal of self-serve analytics isn't letting everyone define their own truth. It's letting everyone explore the same truth without waiting on the data team.
Common Pitfalls and How to Avoid Them
Even with solid definitions, teams still misuse metrics in predictable ways. The number isn't always the problem. The behavior around the number usually is.

Four mistakes that show up constantly
Vanity metrics: Total sign-ups, total page views, and raw follower counts can look impressive without telling you whether the business improved. Ask what decision would change if this number moved.
Metric overload: Teams dump every available chart into one dashboard and call it visibility. In practice, nobody knows what to prioritize.
Missing context: A number without operational narrative can mislead just as easily as a wrong formula. A retention dip might reflect pricing changes, product outages, or a cohort mix shift.
Local definitions: One team changes logic to fit its workflow, and the rest of the company discovers the mismatch too late.
Practical antidotes
You don't fix these issues with more reporting. You fix them with stronger operating discipline.
For vanity metrics, tie every metric to an owner and a decision. If no one acts on it, archive it.
For overload, cap KPI count aggressively. Teams can monitor many metrics, but leadership should focus on a small active set.
For missing context, pair numbers with commentary. Add short notes on major business events, segment changes, or known data caveats.
For local definitions, centralize metric logic. Don't let every dashboard author reimplement business rules.
A metric becomes dangerous when it looks objective but hides assumptions nobody can see.
The trap I see most often is metric fixation. Teams optimize for the metric itself rather than the outcome it was meant to represent. That's how support teams close tickets quickly without solving problems, or growth teams increase sign-ups without improving retention. Good governance means reviewing whether a metric still reflects the actual business objective, not just whether the chart is moving up.
Frequently Asked Questions
How many KPIs should a company focus on at once
Fewer than is often believed. If everything is key, nothing is. Keep the executive set small enough that leaders can discuss each KPI in one meeting without rushing through definitions, drivers, and actions.
What's a good starter set for a B2B SaaS startup
Start with a balanced core: one revenue metric, one retention metric, one activation or engagement metric, one pipeline metric, and one operational metric such as forecast variance or onboarding completion. Then define each one precisely before adding more.
How often should we review metrics and KPIs
Review operating metrics often enough to act on them. Review strategic KPIs on a fixed leadership cadence. The point isn't frequency for its own sake. The point is making sure the review rhythm matches the speed of the decisions the metric is meant to support.
Who should own metric definitions
Business owners should approve the meaning. Data teams should implement the logic. Finance often needs to sign off on anything tied to bookings, revenue, margin, or forecasting. Shared ownership works best when one team is accountable for the final published definition.
From Measurement to Culture
The true outcome of a strong business metrics definition isn't cleaner dashboards. It's organizational alignment.
When teams trust metric definitions, they stop re-litigating the basics. Product can discuss behavior. Finance can discuss trade-offs. Go-to-market leaders can discuss execution. The data team stops serving as a human reconciliation layer and starts building infrastructure that scales decision-making.
This is also where culture changes. People become more willing to ask questions when they trust the numbers behind the answers. Self-serve works because governance exists, not because governance disappears. Clarity gives teams speed.
If you're trying to build that kind of operating model without expanding headcount first, this guide to building a data culture without hiring a data team offers a practical next step.
A company doesn't become data-driven when it buys a dashboard tool. It becomes data-driven when it defines its metrics well enough that people can act on them with confidence.
If your team is stuck reconciling dashboards instead of using them, Querio is worth a look. It gives data teams a way to define and work from governed warehouse logic in a self-serve environment, so analysts, operators, and leaders can explore consistent metrics without turning the data team into a ticket queue.


